
Here’s a graph of US air pollution over time:
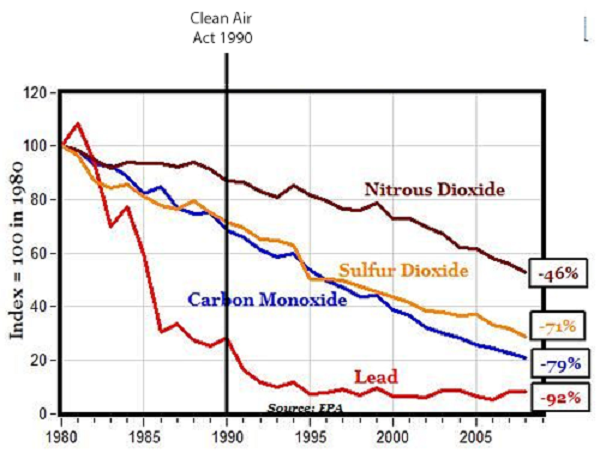
During the discussion of 90s environmentalism, some people pointed out that this showed the Clean Air Act didn’t matter. The trend is the same before the Act as after it.
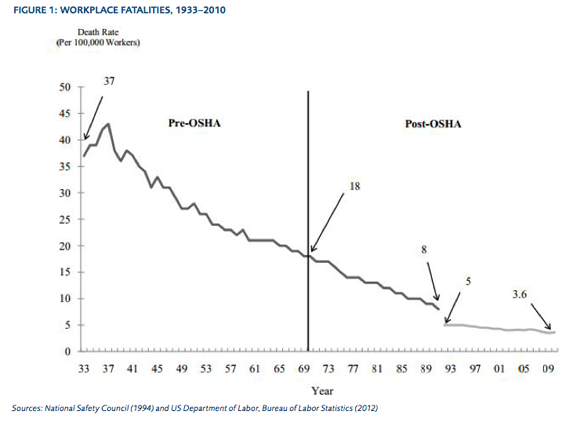
This kind of argument is common. For example, here’s the libertarian Mercatus Institute arguing that OSHA didn’t help workplace safety:
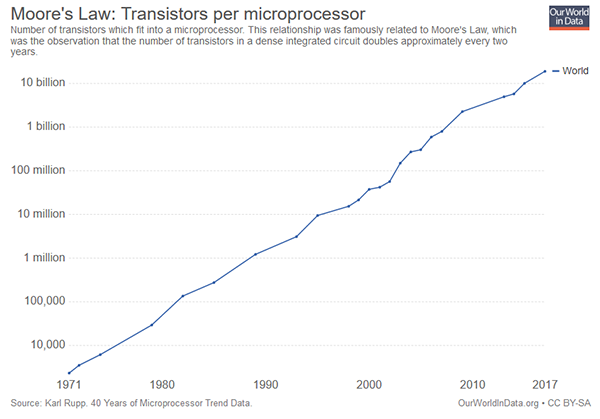
I’ve always taken these arguments pretty seriously. But recently I’ve gotten more cautious. Here’s a graph of Moore’s Law, the “rule” that transistor counts will always increase by a certain amount per year:
The Moore’s Law Wikipedia article lists factors that have helped transistors keep shrinking during that time, for example “the invention of deep UV excimer laser photolithography” in 1980. But if we wanted to be really harsh, we could make a graph like this:
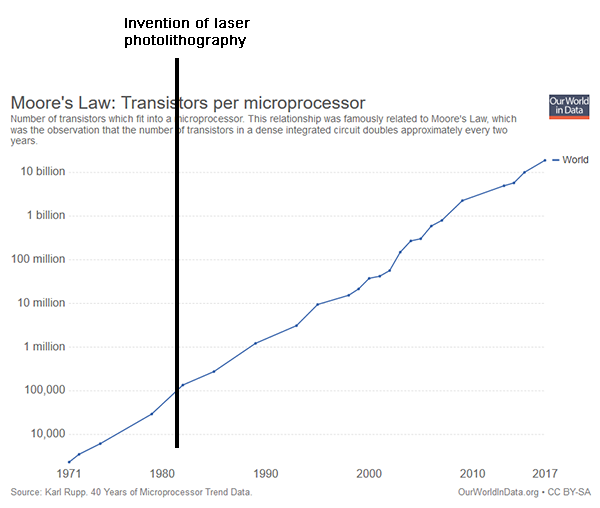
But the same argument that disproves the importance of photolithography disproves the importance of anything else. We’d have to retreat to a thousand-coin-flips model where each factor is so small that it happening or not happening at any given time doesn’t change the graph in a visible way.
The only satisfying counterargument I’ve heard to this is that Moore’s Law comes from a combination of physical law and human commitment. Physical law is consistent with transistors shrinking this quickly. But having noticed this, humans (like the leadership of Intel) commit to achieve it. That commitment functions kind of as a control system. If there’s a big advance in one area, they can relax a little bit in other areas. If there’s a problem in one area, they’ll pour more resources into it until there stops being a problem. One can imagine an event big enough to break the control system – a single unexpected discovery that cuts sizes by a factor of 1000 all on its own, or a quirk of physical law that makes it impossible to fit more transistors on a chip without inventing an entirely new scientific paradigm. But in fact there was no event big enough to break the control system during this period, so the system kept working.
But then we have to wonder whether other things like clean air are control systems too.
That is, suppose that as the economy improves and stuff, the American people demand cleaner air. They will only be happy if the air is at least 2% cleaner each year than the year before. If one year the air is 10% cleaner than the year before, environmentalist groups get bored and wander off, and there’s no more progress for the next five years. But if one year the air is only 1% cleaner, newly-energized environmentalist voters threaten to vote out all the incumbents who contributed to the problem, and politicians pass some emergency measure to make it go down another 1%. So absent some event strong enough to overwhelm the system, air pollution will always go down 2% per year. But that doesn’t mean the Clean Air Act didn’t change things! The Clean Air Act was part of the toolkit that the control system used to keep the decline at 2%. If the Clean Air Act had never happened, the control system would have figured out some other way to keep air pollution low, but that doesn’t mean the Clean Air Act didn’t matter. Just that it mattered exactly as much as whatever it would have been replaced with.
If this were true, you wouldn’t see the effects of pollution-busting technologies on pollution. You’d see them on everything else. For example, suppose that absent any other progress on air pollution, politicians would regulate cars harder, and that’s what would make air pollution go down by 2% that year. In that case, the effects of inventing an unexpected new pollution-busting technology wouldn’t appear in pollution levels, they would appear in car prices. Unless car prices are also governed by a control system – maybe car companies have a target of keeping costs below $20,000 per car, and so they would skimp on safety in order to bring prices back down, and then the effects of a new anti-pollution technology would appear in car accident fatality rates.
How do we tell the difference between this world, and the world where the Clean Air Act really doesn’t matter? I’m not sure (does anyone know of research on this?). Maybe this is one of those awful situations where you have use common sense instead of looking at statistics.
I’m worried this could be a fully general excuse to dismiss any evidence that a preferred policy didn’t work. But it does make me at least a little slower to believe arguments based on interventions not changing trends.


The field of finance is built around these sorts of problems (time series analysis of observed trends), so they have the best resources on how to approach these problems. I would not agree that the quantitative data should just be dismissed in favor of a purely qualitative approach. A mixture of the two is always necessary. Without getting into the specifics which other commenters have covered, I see several major problems with these graphs:
1) It’s not clear that the correct dependent variable has been selected to most closely track the effects of the specific changes. This is a really big deal with the Clean Air Act graph where the selected DVs are just bonkers.
2) The graphs are too zoomed out. If you step back far enough from anything, the effect size becomes impossible to spot visually.
3) Regulatory and policy changes are rolled out gradually; not overnight. It took ten years for the 1990 restrictions to be fully implemented. OSHA similarly had to take time to set itself up, and become organized to where it could be productive. If we looked at a graph of analog vs digital TV reception and compared it to the time when the law was first enacted that forced everybody to switch to a digital signal, it would look like the law had little effect even though it had a gigantic effect. That’s because everybody waited until the last possible minute to switch over to the new system.
4) Economists are biased on policy issues. If 2 out of 10 economists believe in policy B, but 5 out of 10 think tanks only hire people who support policy B, then 5 out of 10 economists at think tanks will end up supporting policy B. This doesn’t make them useless, but I always double-check everything by considering independent data sources (if this claim is true, then how else can I test for it?).
I’m an electricity consultant and, politically, I consider myself conservative. I think the Clean Air Act is an abomination that gives un-elected bureaucrats far too much power to effectively make new laws. The CO2 emissions regulations from the Obama administration are the worst example, but there are others, but . . .
It’s crazy to argue the CAA doesn’t have an impact on emissions. While it’s true that coal plants have a great deal of trouble competing with clean natural gas plants, without the CAA I can almost guarantee that local jurisdictions would do less to control PM, mercury, SO2, and NOx. The negative effects of these effluents are often non-local. Meaning the pollution from a plant often doesn’t negatively impact the surrounding area nearly as much as it impacts regions downwind. Without federal intervention, I have trouble imagining many state politicians would agree to raise electric rates locally to benefit people living in other states.
Now, I think there’s a very strong argument that the EPA’s regulation go too far and unnecessarily push effluent levels far below the economically optimal level. Their cost benefit analyses often rely on absolutely shady assumptions (for example, the cost benefit analyses for MATS and CSAPR both assumed the other regulation didn’t exist). They always include incredibly speculative claims about people taking fewer sick days, which they calculate as a massive benefit. So, I’m not saying that I like the CAA, but I think it’s pretty hard to argue that it hasn’t reduced pollution at all.
Problems of this type can often be tackled by dissagregation. A straight line can be the sum of many components, some with clear structural breaks that standard techniques can identify.
Additionally, we can find evidence that a regulation is binding by finding clumping near the legislative limit.
Let’s say some city has slowly declining, but still pretty high murder rate. To solve it, the city council instituted a policy of sacrificing a chicken each Tuesday noon in front of the city council building. The murder rate continued declining in the same way.
I don’t see how the same argument as described above can’t be used to show that the chicken sacrifice policy was a necessary – and maybe even inevitable – step in the overall policy of crime fighting, part of the murder control system developed by the city.
That is because what is shown here isn’t actually a rebuttal to an argument people typically make. Its a rebuttal to a rebuttal.
I tried to use apolitical examples in a post above, but all the examples that Scott has in the OP are examples of rebuttals to the argument where someone starts a graph at “the line” and then shows how awesome their favored policy is.
Like you could go to the list of French Nobel Laureates: Start the Clock at 1945 and say, “look those American soldiers really taught the French how to be smart!” But that would be idiotic based on the list we have that predates 1945. But people do make the first argument all the time, so they must be rebutted.
At least in regard to air pollution, the laws do matter and they’re part of a control system. The general rule is that when a country gets rich enough to host its first Olympics is when air pollution is the worst; after that the population starts pressuring the politicians to trade cleaner air for slower economic growth. This pattern more or less happened in Mexico. It happened in spades in Japan, where the air in Tokyo was almost unbreathable at times, and it happened in Korea. China sort of breaks the pattern, because its high-pollution phase persisted well after its first Olympics.
Makes sense, since China has (had?) a very large rural population that took proportionally longer to fully industrialize.
I’m not sure it’s correct to read the first graph as showing that the Act didn’t affect the trend.
The nitrous dioxide line pre-Act looks kinda flat. It may just be a random fluctuation that it dipped immediately before the Act was past. In any case, the decline certainly seems steeper since c1999, and the intervention may have a long lead time. I’d want to see more details.
Conversely, the lead line does go down steeply immediately after the Act. It then levels off, but to some extent that must be because it’s bounded below by zero.
Sulphur dioxide has a marked decline in c1994, which again could conceivably be because the relevant provisions didn’t take effect until then.
Carbon monoxide I agree looks unaffected.
While my biases and preferences are strongly inclined to protect the Clean Air Act, if you told me to make policy, I would just adapt Wins Above Replacement in as many cases as I could.
https://en.wikipedia.org/wiki/Wins_Above_Replacement
Does this provide a partial answer to your question on how likely are multifactorial trends?
Well in some cases the world conveniently provides multiple situations you can compare. For example in 1996 Australia passed strong gun control laws, and after they were passed there was a sharp drop in gun deaths, though consistent with the overall trend. Is this the law keeping the line straight, or the line being straight regardless of the law? Well if we compare Australia with America, we can see that America was also experiencing dramatic reductions on gun deaths around the same time period without any changes in gun control legislation. Indeed the sharp drop immediately after Australia passed gun control legislation seems about as steep as the drop that America was experiencing for the majority of the 90s. It seems reasonable to conclude then, that the law didn’t really do anything.
Only if the USA didn’t change anything.
Anyway, those two lines aren’t even remotely the same shape. It doesn’t make any sense for you to think those lines support the idea that the same thing was going on in both places.
Surely this is backwards. A new pollution-busting technology means pollution can be reduced more cheaply, so cars get cheaper while they have some ‘slack’ in the pollution levels. Eventually the required pollution level gets low enough to take up all the gain from the new technology, and car prices go back up to normal.
Not that I necessarily accept the premise exactly — to the extent that things like “pollutingness of cars” are driven by popular demand rather than complex (and probably inadequate-equilibrium) power dynamics, we would expect there to be a single “tech level and wealth level of civilisation” line (not necessarily straight) and everything from air cleanliness to computing power to how tasty food and drink are would all follow that same line (up to a perhaps nonlinear but still strictly increasing function), because of marginal substitution. I’m oversimplifying of course (stuff like Giffen goods could mess it up), but not as much as you probably think.
Perhaps I missed the point, but I’m not sure the premise here (that the up and to the right log line is bizarrely straight and therefore the rate of change is bizarrely constant) is true? If you look at log gdp since 1900 the line looks very straight – you almost don’t notice the Great Depression. But if you graph yearly changes or even ten year changes there are clearly periods of faster and slower growth. Lived experience certainly bears that out, and I’d guess a proper statistical test would establish that the rate of growth is not constant in all time periods. Is this just a case of visual econometrics being deceptive?
Title is overly cute. If it was titled “Do events affect trends or do trends affect events? The answer is an intuitive “both”.
This is really important. I think that rater than “control systems”, complex systems just have a lot of inertia. Changes that seems like they cause a step change actually cause a slow change spread out over time. Environmental laws usually only apply to products made after the law takes effect, so they take a while to replace existing products. The first version of a revolutionary new technology is too expensive, doesn’t work very well and people are careful.
The few times you see an abrupt change in the graphs (https://slatestarcodex.com/2019/02/25/wage-stagnation-much-more-than-you-wanted-to-know/) it’s probably because a temporary chock (e.g. Oil Crisis) happened at just the right time.
Douglas Knight, totally! I wasn’t saying that the 1990 amendments didn’t do anything, rather there were already regulatory forces in place before 1990. And you’re totally right that SO2 and NOx emissions have come down a ton since then (and even in the past 10 years). I’ve been thinking about the changing aerosol pH in a couple different projects I’ve worked on recently.
The main point I was trying to address was that the premise that there were no regulatory forces on those 4 pollutants before the 1990 clean air act amendments (emphasis because the figure and discussion describes the 1990 legislation as simply the “clean air act”) is flawed.
How familiar are you with S-curves in technology Scott?
I suspect legislature designed to produce better outcomes seems to happen around times when some existing technology is on the late stage of the horizon, and another more promising technology is emerging or on the horizon. The First Coal Plant Scrubbers in the US were built in 1967 three years before the Clean Air act. Legislation might change incentives enough to promote additional investment or jump-start the next technology and smooth out the two curves into a line instead of having a period of stagnation.
For example, new solar installations seem to follow this S-curve trend after 2006, when the a tax-credit scheme was introduced but have leveled off recently, since we’ve hit hard limits again on polysilicon production. I imagine if tax credits shifted again to make panels profitable (compared to fossil based utility electric), or someone incentivizes improving polysilicon then the curve will snap out of its stagnation and continue on its linear trend (until another physical limit levels it out)
I don’t think anyone has posted about this yet, but a common econometric approach to answering causal questions like these is with a “difference-in-differences” analysis. The general idea is to find a “comparison group” that looks similar across both observable characteristics and pre-policy trends (i.e. their levels of air pollution were falling at a similar rate as the US before the Clean Air Act). Then you can compare the difference in their post-policy trends to get an estimate of the policy’s causal impact (while controlling for other factors).
Here’s a nice non-technical example: https://towardsdatascience.com/causal-inference-101-difference-in-differences-1fbbb0f55e85
I don’t know enough to say whether this approach would make sense for evaluating country-wide policies, but it has been used pretty widely to look at state and local policies for things like minimum wage laws and alcohol/drug related laws.
I’m not sure if it would be useful at all in a case like the Moore’s Law example, where we don’t really have anything to compare it to (maybe it could be compared to the progress of other technologies that have improved at a similar rate?).
A third possibility is that the graphs are lies created to have straight lines, with no relation to reality.
My thought on the moores law chart was that it’s using the logarithm of the transistor count.
And if you chart with raw value it’s an exponential curve. One you can zoom in to.
So it’s also easy to draw a graph where any development looks like it precedes an exponential takeoff.
https://qph.fs.quoracdn.net/main-qimg-f9e6ae71dbfa8d59b568552bdcf2e61a.webp
https://cdn.ttgtmedia.com/ITKE/uploads/blogs.dir/284/files/2016/10/Exponential-Moore-2.png
Or to paraphrase an old quote I heard somewhere:
“Anything can be drawn as a straight line if you chart it as log-log and use a thick enough sharpie”
I agree that there’s a problem with what Scott says vis-a-vis straight lines. And I think it’s valid to say, “look at it on a linear scale (not logarithmic); here’s where this technology started a dramatic increase in transistor density”. But the broader point is, “Moore’s law is a long-term trend. The trend does not appear to be affected by individual events.”
I’ve seen a couple people point out that charting the trend on a logarithmic axis is linearizing non-linear data, and therefore makes the point invalid. But the question Scott is really trying to raise seems to be, “why don’t we see evidence of major inventions even in trends where we know it has an effect?” Perhaps when you’re looking at logarithmic trends, even major advances get swallowed up once you linearize the data. But I would at least still expect to see the slope of the graph change a little bit if you’re looking at a significant change.
On the other side from Scott; the argument he’s referring to, “this didn’t affect the broader trend”, is often levied against people who have already argued their preferred intervention caused a long-term trend. They do this by picking the intervention date as the starting point of their graph. The argument usually looks something like, “[X] didn’t affect crime like you said it did because crime was already going down.” The point is not necessarily to state, “this was clearly not causally related to the decrease/increase”, but rather to refute the statement, “[X] clearly caused the decrease/increase”. If you want to show evidence that an intervention is causal, you need positive evidence that this is the case. Pointing to a trend line that was already decreasing and saying, ‘it kept going down after we intervened, so we caused all the observed decrease’ is not valid supporting evidence for a hypothesis that the intervention works.
I feel like Scott’s argument that, “but it could still be working” is obvious but not helpful to the broader search for truth, since the disputed point – whether or not it works – still lacks support after looking at the smooth trend line. Maybe his point is, “don’t give up if you see a smooth trend line”? Maybe, but at a certain point shouldn’t you just throw up your hands and say, “I’m going to follow the evidence where it leads instead of trying to lead it to my preferred hypothesis”?
Indeed. I do think this is a bit of intellectual dishonesty that happened in the OP by Scott. He is, essentially, responding to a defense against an initial attack that is levied, but doesn’t make that clear at all. Very few people go marching around with their graphs of pre-WWII data saying, “man look at all these Germans winning Nobel prizes isn’t that super interesting!” But there are subset of people invested in various narratives that could select various points in the German regime and say, “man look at all these Nobels Germans win after “. Or, people point out all these fun inventions made by NASA during the space race. There are near infinite examples of people trying to justify their pet government projects using data that conveniently starts after their program started.
I’m trying to be generous to Scott here. What I think he’s trying to say is, “When I see a straight-line graph with an intervention in the middle of it, I usually see it as evidence the intervention didn’t work. But what if it did work, it just required multiple successive interventions for the trend to continue, and without this intervention the trend may well have stopped. Or perhaps some other means would have been employed, but [Scott is] assuming that as a second choice it’s likely to be worse than the first choice intervention. Just because it didn’t change the graph doesn’t mean it didn’t continue the trend.”
And there’s some truth to this. Trends continue, until they don’t. It’s possible that improvements in clean air would have ceased if some major piece of legislation got shot down. Not because a bunch of corporate types are secretly villains from Captain Planet, but because the incentives shift. When you don’t know what causes a trend, you can’t say why it continues or why it ends.
All I’m saying is that it remains an untested hypothesis if we see a trend line continuing along as though the intervention didn’t happen. What if I hypothesize that the end of WWII caused improved workplace safety, or that the fall of the Iron Curtain improved clean air? You might point to the graphs above and say, “The data don’t support your hypothesis.” And you’d be right.
I could then turn around and say, “Well we’re talking about a long-run trend that required multiple interventions. My preferred explanation is partially responsible for the trend.”
I still don’t have any data to support my hypothesis. It’s still just a hypothesis. Perhaps I’ve invented some great sounding just-so story about why I’m right. But that doesn’t mean anyone else should be persuaded to believe my evidence-free story, just because I can tell it in a convincing way. There are lots of really convincing ideas that turned out to be flat-out wrong.
The point of expanding the graph to include the years before the intervention is to ask additional questions of the data. “Did this trend start with the intervention in question?” If the answer is no, it’s true that doesn’t disprove the hypothesis. But it does disprove the evidence put forward to support it. Maybe you still like the hypothesis. But yours should be the first attempt to thoroughly disprove it. And if you succeed at destroying all evidence for your hypothesis, maybe don’t waste other people’s time with it until you have something to recommend it. Maybe you still believe it. You like the story. But don’t go talking about it as a ‘true story’ until you can support that statement.
Interesting to read this while I’m three chapters deep into Seeing Like a State (per your and Lou Keep’s reviews/summaries thereof)…
If you’re going to use either logarithmic or linear scale depending on the data, a lot of things will indeed look like straight lines.
The effect under study looks like some kind of random walk / normal distribution phenomenon? Many successes and setbacks in the field sum to give a boring straight line. Still, this is peculiar because you’d expect progress in certain fields to either slow down (low-hanging fruit is exhausted) or speed up (improvements in separate stages multiply together), yet apparently they sort of cancel each other out?
I have to admit I am confused.
A few things to keep in mind:
1. Consider the source of your CAA data. The figure said “EPA” but consider the error associated with measuring pollution levels back in the 1970s. It’s hard to use those time series data as too firm of a foundation to argue if and whether the CAA worked. Also, to cite one example, EPA’s current figures on waste production are low by a factor of two, so measurement is still a challenge even today.
2. The drop in lead emissions in the 1970s was because of outlawing lead in gasoline, which seems to bolster the point that other initiatives can work together to make reductions, not just singular policy moves.
3. The pollutants shown only tell part of the story. SO2 emission trading not only lead to large emission reductions but are seen as an unmitigated environmental success story because of the economic and environmental Co-benefits enjoyed by the general population and the polluting industries.
I suspect an important factor is that environmental laws get phased in gradually over time, often with industry-friendly grandfathering rules that last decades.
Your data show one example where regulation made a huge difference: getting lead out of the consumer environment. People attribute many things to that: higher IQ scores, lower crime rates, etc. Not sure how much of that is true, but clearly reducing lead exposure is good for children and other living things.
It’s one of the few cases where environmental regulation actually made a measurable difference in human well-being.
Another is the prohibition of CFC as refrigerants, another is the prohibition of PCBs and dioxins – at least, I am inclined that the decrease in toxin levels is due to regulation. (I helped with analysis on a recent paper on toxins in arctic cod and haddock, for most of the measured compounds, levels are decreasing)
The first figure involving the 1990 Clean Air Act *amendments* (they were amendments, the original Clean Air Act legislation was in 1970) should not actually part of this conversation.
The EPA’s concentration standards for the four pollutants plotting in that figure (SO2, NO2, CO, and lead) were not affected by the 1990 CAA amendments. The EPA’s concentration standards for SO2, NO2, and CO were set in 1971, and lead’s was set in 1978. None of the standards were changed until 2008. Hence, there shouldn’t be much surprise that the concentrations of these four pollutants were falling before the 1990 CAA amendments, and regulations were a force behind the decreases even before the start of the graph (1980).
Here is a history of the concentration standards for the 4 pollutants.
SO2: https://www3.epa.gov/ttn/naaqs/standards/so2/s_so2_history.html
CO: https://www.epa.gov/co-pollution/table-historical-carbon-monoxide-co-national-ambient-air-quality-standards-naaqs
Lead: https://www3.epa.gov/ttn/naaqs/standards/pb/s_pb_history.html
NO2: https://www3.epa.gov/ttn/naaqs/standards/nox/s_nox_history.html
(I’m a professor of atmospheric science at Colorado State University who studies air pollution: https://pierce.atmos.colostate.edu/)
More data on London pollution levels here: https://ourworldindata.org/london-air-pollution
On that graph, the impact of the Public Health Act for London in 1891 is clearly visible, but the 1956 Clean Air Act (passed after a particularly deadly smog) is not. Though the graph looks far too linear anyway, especially compared with the Delhi one.
Nice link. What part do you think looks too linear, the later part is probably based on some pretty good data. I am guessing that lower pollution levels are more stable than highers one?
The data points for London before 1993 were created using linear interpolation. You can download the data and check for yourself if you like.
I guess the essence of this article is that just because the data doesn’t allow you to dismiss the null hypothesis (that business continues as usual as if your event never happened), that doesn’t mean it is true (that your event had no effect). It would be interesting to ask what the power is for each of these cases, as pointed out below¹, the Moore’s law graph is both exponential and has very few data points before the invention of excimer lithography. Extrapolating from those four points, what is the confidence interval for transistors per microprocessor? I bet it is pretty wide. And, uh, wouldn’t it be more interesting to compare transistors per area, rather than per chip?
Of course, from this image, it looks like the invention substantially slowed down progress. I think what really happened, was that demand increased exponentially, many small manufacturers got consolidated or out-competed, and there was a much stronger economic pressure on technology improvements – bascially, the effort argument. Players who couldn’t keep up eventually left the game (DEC, National, HP, NEC, Fujitsu, Motorola, TI…) after those hectic years in the nineties.
I also think there is a big difference between legislation and technical progress. The decision on whether to invest in R&D can (mostly) be left to businesses, and mis-investments are their own punishments. Similarly, “investing” in ineffective laws and bureaucracy has a large cost, but while politicians get to bask in the glory of having Done Something, the cost is borne by the citizens in the future. I read that the Clean Air act imposed a cost of $65 billion² – are we really going to accept that it has no observable effect, but we need it because…well, because what, exactly? Because it is one of a million things that may or may not make a difference?
¹ Or above, I don’t know how this gets sorted.
² I don’t know if this is accurate, and don’t much care. These things are never free, and it’s just an example.
Eventually Moore’s law became an explicit planning principle used to coordinate the efforts of the myriad manufacturers that make all the different machines needed in a fab. It does no good to build an apparatus suitable for 20 nm feature sizes when the other machines on the line can only go down to 40. These plans were publicly codified in a series of documents over the years called the international technology roadmaps for semiconductors. This is I think an underappreciated facet of Moore’s law important to understanding it from the early 90s onward.
Indeed.
My guess with the excimer laser photolithography thing is that the companies rolled it out on their production lines on a time-scale to match Moore’s Law. Re-tooling your whole factory is really expensive (has gotten more expensive over time but I’d guess at least on the order of $10M back then), so you don’t want to do it more often than necessary. ”
EDIT: that is to say, basically you’re control systems point, but the “controller” is the engineering implementation at the production level rather than at the research level.
(In fact, I think ex.las.phot. is pretty close to your theoretical “shrink things by 1000x” event.)
(In the other direction, we’re pretty close to running out space in the channel — I think we’re down to about a few tens of silicon atoms? So that’s a “physical law that makes it impossible to fit more transistors on a chip without inventing an entirely new scientific paradigm”. Last I was paying attention–2017–people were speculating that we would run into this in the early 2020s.)
> In the other direction, we’re pretty close to running out space in the channel — I think we’re down to about a few tens of silicon atoms? So that’s a “physical law that makes it impossible to fit more transistors on a chip without inventing an entirely new scientific paradigm”.
People have been predicting the end of Moore’s law since the mid 80s. And yet it still keeps marching on. Yes you start to run into atomic limits. But single atom transistors are already in early stages. So, that alone takes you out to the mid-2020s. Then beyond that there’s still a number of improvements, that effectively mean the same thing as more transistors. 3D integrated circuits, carbon nanotubes and silicon alternatives, spintronics, cold computing, fast-switching transistors, reversible computing, memristors, software defined hardware, optical chips, and tons of other speculative technologies.
My guess is that we pretty much see a much longer continuation of Moore’s law than anyone expects. At least in the spirit of memory capacity and processing power doubling every two years, if not the literal definition of doubling transistor counts. I’d guess it continues out to 2045 or later.
We won’t have CPUs made of single atom transistors until long after the 2020s.
People have been predicting the end of Moore’s law since the mid 80s.
That depends on exactly what counts as Moore’s Law. The exact literal version dealing with number of transistors may still be true, but many of the versions of it with interesting real-world implications have already ended some time ago. Processors aren’t doubling in capability every couple of years any more, and they used to.
One point that should be drawn from this is to be skeptical of the argument “If it wasn’t for regulation X everything would be completely horrible.” Ex. “If it wasn’t for OSHA, workers would be regularly killed and maimed.” or “If it wasn’t for minimum wage laws unskilled labor would have to work for 2$ an hour.” I’ve seen too many anti-libertarians make this type of claim.
OSHA could be a good and cost effective way of increasing workplace safety. OSHA could be a waste of resources with minimal effect. OSHA can not be the only thing standing between 2019 and 1919 levels of workplace accidents.
A “secret” of the majoritarian legislative process is that most laws follow, rather than lead. For example, child labor in the U.S. was virtually non-existent except in two industries when Congress got around to banning it. Guess which two industries they just happened to create exceptions in the law for at the time?
The basic mechanism is that a large number of people, if not most people, change their minds about something being okay or not and change their behavior as a result as well as the behavior of those they can influence (businesses, etc…) and then start agitating to change the law. But by the time the law is put into place officially banning or changing whatever it was people have changed their opinions about, pretty much everyone has already changed their behavior as well.
Does this make those laws useless? Not exactly, but they certainly deserve a lot less credit than they normally get in certain academic circles.
Where a change in the law does tend to make a difference is in reverse proportion to how democratic the result is. So if Congress decided tomorrow to ban all raising of cows for food (which is an idea out there somewhere, but not anything like a large proportion of either major Party) and Trump signed the law, THAT law would make a big difference in behavior, precisely because it wasn’t supported by the vast majority of Americans. Conversely, if India decided tomorrow to ban all raising of cows for food, it would only affect two out of 29 states, because the rest of India is vast majority non-beef eaters and thus it’s already been banned in the other 27 at the local level.
This is how I see this as well. I see the laws as the effect of societal changes in attitudes.
For example, changes in attitudes about the environment led to millions of humans, including the humans who run polluting companied, making individual decisions that improved air quality. A bunch of politicians seeing the political headwinds decided to make themselves look good by passing the clean air act.
You can think of the clean air act as useless, in that it didn’t cause the improvements. Or you can think of it as a safeguard that prevented backsliding. The way to resolve this is to look at a similar societal change that didn’t get enshrined in law as your control.
“humans who run polluting companies, making individual decisions that improved air quality…”
No. The worst-polluting companies tend to be in purely competitive, Moloch-dominated markets (energy generation, mining, resource extraction, farming), and they most definitely pollute as much as they can get away with, at all times. Whenever they reduce pollution more than govt regulations require, it is entirely because there is a justified belief that this will lead to reduced overall regulation in the long run.
I worked for a company (based in a liberal state) that managed coal power plants (mostly outside that state). We had recycling bins. We also installed improved mercury filters at the coal power plants ENTIRELY because we wanted the govt to grant us more sulfur pollution credits. Our power plants were so old and bad that we got a certain amount of credits grandfathered, and we wanted this quantity to be as high as possible.
There is no way we would have done this out of the goodness of our little hearts. Even if most of us wanted to (which is likely), we wouldn’t have been able to justify it to shareholders.
Moloch needs chains.
“entirely” is an overstatement. There are at least two other possible reasons:
1. Because the change that reduces pollution also saves them money. Recycling is an obvious example. If your fracking operation produces polluted water, it may pay to filter out the pollutants and sell the purified water for agricultural use (real example from a conversation with a chemical engineer yesterday, although I may have the details wrong).
2. Because the pollution imposes costs on the polluter. The obvious example would be air pollution that makes it less pleasant to live near the factory, which makes it more expensive to hire workers. If it isn’t too expensive to reduce the pollution, it may be profitable to do so.
Interesting how this can line up very well with left-oriented approaches. The threat of huge added external costs (regulations, fines, etc.) can have the effect of causing a rational polluter to reduce pollution, even absent any law requiring it. PR campaigns serve similar functions.
No, because it’s the same freeloader problem. Each firm has an incentive to pollute, and rely on the voluntary reduction by all the other firms to keep the feds off everyone’s back. It’s a different “commons” but it’s still a tragedy of the commons structure.
Only when the industry can manage some way of coordinating and enforcing collective action/collective restraint (like with the Hays Code & MPAA ratings) can you avoid a tragedy of the regulation-commons.
Sounds like something that never happened once in all of actual history.
What were the two child-labor industries? I would guess one would be acting, but I can’t imagine what the other one could be.
I would have guessed farming and restaurants. I just looked on Wikipedia, however, and it doesn’t seem like there was a two-industry exemption in the original law. It’s description of the 1938 Fair Labor Standards Act says, “Children under eighteen cannot do certain dangerous jobs, and children under sixteen cannot work in manufacturing or mining, or during school hours.”
So, it sounds to me like child labor was originally prohibited in two industries, not exempted in two industries. IIRC the reason children were originally required to stay in school until the age of 16 was because they didn’t want children taking jobs from adults during the depression.
My reading of the law is that all work is prohibited for those under the age of 16 except if the employer is a parent or guardian. If the work is mining or manufacturing then that is prohibited, even for parents. My guess is that farming and restaurants were the industries that employed the most children and those were also the ones where parents were the employer.
I was thinking of the Fair Labor Standards changes in 1949. Previously, they’d added some restrictions to Child Labor at the federal level, but the 1949 changes were what essentially outright banned it in most industries, with exceptions.
The exceptions for Child Labor (See section 13) were in agriculture, “any child employed as an actor in motion pictures or theatrical productions”, and “Newspaper carrier boys”. I forgot about that third one, but it fits the same pattern of exempting where children were still commonly accepted as working.
I couldn’t find online the book I originally saw the industry-specific statistics in, but this economic history article is a decent substitute:
So by 1930 M/F child labor combined was down to 4.65% and 2/3 of those were working in agriculture.
Redo those stats looking only at the Southern states. The Northern states adopted child labor laws voluntarily. The Southern ones needed the federal government to force the change on them. (Sound familiar?)
https://en.wikipedia.org/wiki/National_Child_Labor_Committee
In 1908 the National Child Labor Committee hired Lewis Hine, a teacher and professional photographer trained in sociology, who advocated photography as an educational medium, to document child labor in American industry. Over the next ten years Hine would publish thousands of photographs designed to pull at the nation’s heartstrings.[6]
[…]
Immediately after its conception in 1904, the National Child Labor Committee (NCLC) began advocating for child labor reform on the state level.
[…]
Although the NCLC made some strides in the north, by 1907, McKelway and the NCLC had achieved little success in enlisting the support of the southern people and had failed to pass any far-reaching reforms in the south’s important mill states. Consequently, the NCLC decided to refocus its state-by-state attack on child labor and endorsed the first national anti-child labor bill, introduced to congress by Senator Albert J. Beveridge of Indiana in 1907
I could see it on child labour; there you have social attitudes among the parents of the potential child labourers, and trends in how much value children really add.
But it would be surprising on pollution; are companies in competitive industries really swallowing the price of unpriced externalities for social reasons?
Energy companies, like all companies, shift with technology. When the clean air act of 1970 was written it exempted 30ish year old coal plants on the basis that they would soon be decommissioned soon anyway as 30 years was the expected lifespan at the time. Newer technologies tend to be cleaner, you don’t build a new style of plant unless it will get more power from the same amount of coal (or some other gain) so often (not always) efficiency gains and lower pollution go hand in hand.
There is a strong case to be made that air pollution is worse now than it would have been without the 1970 act (I don’t know about the other acts), because it grandfathered in coal fired plants built in the 40s which would have been replaced, and likely replaced by cleaner burning natural gas as technology improved in that area. I believe there are areas that sill get their electricity from 80 year old coal plants that aren’t required to have scrubbers on their effluent.
Surely there are also tragedy of the commons / prisoner’s dilemma situations, where everyone wants a behavior changed but nobody does it voluntarily because it’s net negative on an individual level.
Perhaps more charitable way of thinking of laws would be as “backstops”. Public opinion changes on X, reducing X and eventually making X unpopular enough to get X banned. But public opinion is malleable, and may reverse. By having the law in place, there’s a certain formal resistance mechanism which imposes a lag in change in the reverse direction – X is completely forbidden, and X proponents need to spend a lot of time dragging public opinion back up over 50% before they get any benefits at all. This makes it harder for niche interests to arise and use X in the meantime.
I agree 100% that laws follow rather than lead. The backstop idea is an interesting one. I think it’s largely a popularity grab. Politicians see that people care about child labor. It’s obvious as they’ve been working against it. It’s easy to gain popularity by voting for child labor laws, and almost no politician is going to be tarred as “In favor of child labor” because they think the law isn’t needed.
There is the strange phenomenon that court cases seem to lead, rather than follow. The landmark segregation cases of the civil rights era seemed to lead opinion (at least in the south, if not nationally). Gay marriage also came before parts of the country were willing to accept it. I’m not sure what to make of this. It’s especially weird considering that the founders designed the legal branch to be the least democratic and most conservative branch of government with lifetime terms, appointment rather than election, etc.
The court example is actually a kind of misnomer in most cases. Brown v. Board (1954) was indeed ahead of public sentiment. The Topeka, Kansas school system was actually already on verge of being integrated (middle schools had been since 1941). In the other places the ruling applied to, it didn’t get implemented successfully until the mid 1960s at the earliest.
The resistance to application is actually more evidence for court decisions leading public opinion.
Congress outlaws child labor: “Whatever, we already weren’t employing children. It’s done.”
Courts rule school integration: Riots. Resistance. Etc.
I’d expect resistance when some rule leads public opinion, because it’s something people aren’t ready for. When it follows public opinion, people are already doing it, or at least they feel guilty for not doing it.
https://en.wikipedia.org/wiki/Lewis_Hine
https://en.wikipedia.org/wiki/National_Child_Labor_Committee
According to the 1900 US Census, a total of 1,752,187 (about 1 in every 6) children between the ages of five and ten were engaged in “gainful occupations” in the United States. This number represents a fifty percent increase from the 1,118,356 children working for wages in 1880.[9] This trend alarmed Americans who, while supporting the traditional role of children in agriculture, found the idea of American youth laboring for meager wages in industrial factories appalling. From 1909 to 1921 the NCLC capitalized on this moral outrage by making it the focal point of the NCLC campaign against child labor.[8]
In 1908 the National Child Labor Committee hired Lewis Hine, a teacher and professional photographer trained in sociology, who advocated photography as an educational medium, to document child labor in American industry. Over the next ten years Hine would publish thousands of photographs designed to pull at the nation’s heartstrings.[6]
[…]
Immediately after its conception in 1904, the National Child Labor Committee (NCLC) began advocating for child labor reform on the state level.
[…]
Although the NCLC made some strides in the north, by 1907, McKelway and the NCLC had achieved little success in enlisting the support of the southern people and had failed to pass any far-reaching reforms in the south’s important mill states. Consequently, the NCLC decided to refocus its state-by-state attack on child labor and endorsed the first national anti-child labor bill, introduced to congress by Senator Albert J. Beveridge of Indiana in 1907
[…]
In 1912 the NCLC succeeded in passing an act establishing a United States Children’s Bureau in the Department of Commerce and Labor. On April 9 President William Taft signed the act into law, and over the next thirty years the Children’s Bureau would work closely with the NCLC to promote child labor reforms on both the state and national level
In 1915, the NCLC, facing the varied success and inherent limitations of its efforts at the state level, decided to move its efforts to the federal level.
Every single example, including the child labor one, is the north leading the south. The north abolished slavery first, then federally forced it on the south. The north abolished/regulated child labor, then forced the same on the south. The north passed fair housing acts, federal government forced it on the south through civil rights act. Northern states (NH, VT, NY, CT, DE, MD, and DC) legalized gay marriage by legislature, federal government forced it on the southern states by court order.
North leads South. First the northern state governments pass a law with a local majority, later on the federal government forces the same change in the southern states without a local majority.
Court vs. legislature doesn’t even matter, It can be one or the other. The underlying principle is that the south is more conservative than the north.
Is that really about “majoritarian legislative process” or is it just about the US federal government whose jurisdiction overlaps with the state governments?
First things get forced on the people through state governments, where local majorities exist. Later, the when majority gets much bigger (and most states are already forcing the policy on most of the people) the policy is forced on the remaining minority of people through the federal government.
This is not at all the same thing as people spontaneously following the law before it’s passed without anyone forcing them.
Every single USA state regulates child labor. Here is a article with some maps summarizing the state regulations before Congress got involved:
https://slate.com/human-interest/2014/01/child-labor-history-maps-showing-regulation-of-kids-work-in-the-1930s.html
(Actually, as the article notes, some of the state regulation followed the SCOTUS-overturned Keating–Owen Child Labor Act of 1916. So the full story doesn’t necessarily fit neatly into a simple “federal always follows state” paradigm.)
Again, federal follows state — not spontaneous unforced action. A majoritarian legislative process with a larger jurisdiction follows majoritarian legislative processes with smaller jurisdictions internal to it.
All I know is what I’ve in the last couple of hours read on wikipedia just now and a bunch of papers it points to, plus some EPA materials. It leaves me feeling that the CAA ‘example’ is so incomplete (without some serious and objective studies behind it) that Scott’s analysis and (somewhat) dismissal of the point is spot on.
It seems clear to me (from the minimal study noted above) that a lot of the US environment acts (often called clean air acts): 1955, 63, 67, 70 (major: “the” Clean Air Act), 77 (amendment to 70, minor except that a lot of it specifically to address achievement failures from 70), 90 (major: but also amendment to 70) – altogether create a _very_ slow _process_. States are supposed to take the lead, and this happens slowly over time (and some fail, and then FDA or congress steps up enforcement (’77), leading to eventual improvements.) The FDA can ratchet up requirements over times and across several areas in a gradual and non-synchronized fashion (e.g. ramping up of car efficiency standards slowly after 1990 until at least 1.5 decades after). The process can as part of enforcement (FDA) and the law (a lot of 77, some of 90) specifically target weak points (e.g. states) left by the prior process – which all seems a lot like a control system as Scott exists.
So from what I see, it would be insane (and IMO you out yourself as a nut if you tried to defend it) to expect a actual step change in outcomes (pollution level) on the passing of one of these laws. But more reasonably and so more controversially: you might argue that even the first derivative should change at that time. But IMO this seems a real stretch given how diffuse and process-like the legislative changes actually are, and (particularly important) the diffuse and delayed nature of state-level implementation.
Second derivative changes: sure, you should expect that!! – but these are rather hard to pick out from one graph! I (personally) would had to deny that this is almost certainly a real thing, but likewise I wouldn’t look to these graphs as evidentiary either way.
So how big and sudden do things need to be to cause a clear first-derivative change? What I read suggests that pre-60 vs late-60’s (from almost no states cared at all about pollution, to most doing so, _at least nominally_ by end of 60’s), and then 70 to 77 (when the feds including EPA get really active, with the 70 law behind them) should be MUCH sharper tests than post-1990 (less dramatic change, and likely more time-diffuse effect.) But … it seems hard to get such data. A graph that starts at 1980 (like Scott’s) isn’t necessarily dishonestly cherry-picking – it’s just what we have and trust. But it is nevertheless oblivious to some sharper and recent tests of the thesis.
The EPA site has some late 70’s report which are ambiguous to interpret but – to my eye – do show some rather abrupt jumps on a number of measures from 70,1, {2, 3} to 74,5,6.
Scott’s graphs are inspiring though. Population has grown, as has economic activity (beyond population growth) and we are doing _that_ well in decreasing (some measures of) total pollution! 🙂 I don’t think Moloch would allow this, so there is some counter- force.
Here’s an informative paper about lead:
http://web.mit.edu/ckolstad/www/Newell.pdf
which mostly talks about the FEDs gradually ramping-down of gasonline lead limits (and the challenges they faced, and how these were dealt with) until “A ban was enacted in 1996, but by then virtually all lead had already been eliminated.”. Scott’s graph agrees with a rather discrete first-derivative change about then!
Well, it doesn’t prove that lead levels wouldn’t have declined somehow, anyway, and this is just when the FDA happened to notice that lead had basically gone away, but the paper presents a good causal story involving regulation. What’s the counter argument – because lead is useful so surely _something_ must have happened to produce this decline then plateau!
Lead doesn’t follow the nice linear trend with no change at regulation points. Which should make us more suspicious about just-so-stories about the regulation happening to have been put in place just in time to continue the trends with the other pollutants.
I admit that I’m not an expert on this history, but the first Clean Air Act was in 1963, with various updates and expansions following. There were apparently big expansions in 1970, 1977, and 1990; the last is presumably what’s just being called the “Clean Air Act” above, but it was the last major expansion, not the beginning of the process. So it’s not clear why the explanation wouldn’t be that the steady decline after 1990 was a result of increasing compliance with the 1990 rules over time, and the steady decline before 1990 was a result of increasing compliance with the earlier rules over time, which would suggest the sequence of ever tightening rules has been working.
Yes, exactly. I gave links to the history of the US ambient concentration standards for the four pollutants in the figure in a separate comment (sorry that I saw your comment after).
Also, it is very plausible that companies knew in advance what minimum regulations are likely to be passed and adapted slightly even before the law took effect.
The regulatory standards for those 4 pollutants were set in the 70s and they did not change with the 1990 Clean Air Act amendments. Here’s a history of the concentration standards for the 4 pollutants.
Here is a history of the concentration standards for the 4 pollutants.
SO2: https://www3.epa.gov/ttn/naaqs/standards/so2/s_so2_history.html
CO: https://www.epa.gov/co-pollution/table-historical-carbon-monoxide-co-national-ambient-air-quality-standards-naaqs
Lead: https://www3.epa.gov/ttn/naaqs/standards/pb/s_pb_history.html
NO2: https://www3.epa.gov/ttn/naaqs/standards/nox/s_nox_history.html
The concentrations were dropping because of the 1970s regulations. The first figure in this post is deceptive (seems to be unintentional on the part of the author), and to a degree this discussion about the figure is moot.
You don’t establish that these pollutants decreased because of the 1970 clean air act.
As I mention upthread, the first municipal air pollution regulation was put in place in 1890. It’s nit just that there were already national acts in force but that concentrating solely on a single national act and ignoring all others seems something of a red-herring.
Jumping in front of a passing parade, pretending to lead it.
This sounds like a fungibility sort of argument. My economics professor snarked once that if we wanted people to drive safely, we should affix a spike to the center of everyone’s steering wheel. Ceteris paribus, seatbelts make people safer, but this effect is muted in practice [citation needed] because people would prefer to drive faster and more recklessly while preserving roughly the same margins of safety.
As far as trying to determine whether this sort of fungibility is responsible for straight lines, we should look at places where those sorts of control systems are not in place and see if the same lines exist there. This isn’t a perfect fix, because confounders totally exist, but if you compare the environment in other parts of the world with different social or political norms (maybe with similar technology, although you risk controlling for what you are trying to study), you could compare whether their environment follows a similar graph.
I believe the spike on the steering wheel was due to Gordon Tullock, so either you were a student of his or your professor borrowed the idea.
“The Effects of Automobile Safety Regulation,” Sam Peltzman, Journal of Political Economy Vol. 83, No. 4 (Aug., 1975), pp. 677-726
But your summary is not quite right. There is no reason why people would want to preserve the same margins of safety.
Peltzman’s argument was that if you made cars safer that reduced the cost of driving fast or doing other things one would want to do if it were not for the risk. If you reduce the cost, people will do more of those things. But the implication is not that the highway death rate would stay the same, just that it would not fall by as much as a calculation which ignored the effect would predict.
The fact that the particular changes he was analyzing did leave the death rate about the same was a conclusion from the data, not anything implied by the theory.
Gordon Tullock was not my professor, but I am happy to acknowledge that my professor did not invent the example—I don’t think he made any claim to originality either.
I didn’t mean to say that highway deaths would stay constant in the face of increasing safety margins. That is a question about elasticity of demand for safety, which I elided because it didn’t seem especially important in this context. The main thing is that empirical safety margins should go up by less than their theoretical counterparts because people (rationally) value things besides safety and are to some extent willing to substitute safety for those things. This same idea should hold when considering environmental impacts and pollution laws.
I always thought the main point of that argument was: “if your only goal is reduction of traffic deaths, this is how you would attempt it.”
In reality, improved safety of cars due to new technology allows for some combination of less deaths or improved transport per unit time. The exact ratio of these two things is directly or indirectly revealed preference.
Surely the spike isn’t supposed to reduce deaths.
Sure, that’s exactly the point — to make you drive as if your life depended on driving safely. In fact, it does, but it’s easy to forget; the spike is a vivid reminder.
The spike doesn’t reduce deaths, it improves driving.
Yes, people will behave more carefully when it’s more dangerous. No, people won’t have better survival rates when it’s more dangerous.
Maybe I’m not grasping your point.
You might be saying that people would crank up their carefulness in response to this added danger, just as we suppose they have cranked it down in response to various safety features, with the result that the actual expected value of injury or death is the same.
And that might well be true. But it might not; as I said, the idea behind the modest proposal, as I understood it, is that people don’t really have a clear idea of the danger they are in when driving, but the spike makes it really, really clear in a way that most people would grasp. And in that sense the point of the spike literally is to reduce deaths.
Of course, it’s definitely a “modest proposal” and not intended as anything but an intuition pump.
I am pretty sure that was not Gordon Tullock’s idea. His alternative proposal was to use the mechanism that is currently used to set off an airbag, but wired to a hand grenade instead.
The idea wasn’t that people were irrationally ignorant of the danger of driving. It was that if you made accidents much more dangerous individuals would rationally act to reduce the chance of an accident, whether by driving very carefully or not driving at all.
That depends on how much more carefully people drive as a result. It decreases the number of accidents, increases deaths per accidents. The net effect could be an increase or decrease in deaths.
If drivers are adjusting their behavior to maintain the same risk level, then you’d expect the drivers drive just enough better with the spike to get to the same risk level they had without it. But pedestrians are probably a lot safer when all the drivers have spikes instead of airbags!
Pedestrians will behave more recklessly.
@Andrew Cady
Why? If I’m driving with a spike (or hand grenade, sheesh!) on my steering wheel I’m not slamming on my brakes when some pedestrian walks out in front of me…pedestrians will be safer because they know drivers will not take risks to avoid hitting them anymore (assuming rational pedestrians).
Risk is convexly increasing in speed for given traffic and road conditions, so we would expect safety improvements to lead to both a decrease in injury and a slight increase in speed.
This is especially the case in congested roads conditions so here we expect almost all of the gains to be realised as a safety improvement.
Traffic laws also encourage people to realise the potential gains as a safety improvement, as increased speed has the cost of both increased risk and fines and license suspensions etc. – though reduced risk from safety devices may push for legislation to increase speed limits.
The obvious complication here is that motorists probably have very poor perception of actual risks, and it may be the case that some technology so greatly increases the perception of safety that actual risk rises even if risk would fall if the drivers had accurate risk perceptions – this may be a partial effect of modern cars that feel stable and free from noise and vibration even at high speed.
There’s a name for this effect (which I forget), that increased safety measures lead to more recklessness and a total increase in harm. So e.g. mandating bicyle helmets or whatever – but from what I have seen, such an effect has never been observed in practice. So I agree that the effect of safety measures can be “muted”, which was your claim, but more safety measures is approximately always a net win for safety (but obviously not always optimal in other ways).
It’s called Risk compensation or Risk homeostasis. The Wikipedia page states quite a lot of criticism of the strong version (risk is kept constant), while the weaker version (people adjust behavior and act a bit more risky, called Peltzman effect) seems quite established.
It’s important to remember that the word “risk” doesn’t hold moral content in discussions like this one. It just refers to the likelihood of an unwelcome occurrence and the severity of consequences. It’s more like an investment than what people say when they describe someone as “a risk-taker” (meaning that they like to go rock-climbing during blizzards and then smoke a cigarette.)
The “spike on the steering wheel” rationale has been used in real-life road design. See “The Circular Laguna Garzon Bridge in Uruguay” in “Stupid of the Month for March“. It’s a bridge that was designed to be dangerous to drive, in order to get drivers to drive more safely.
While the point is interesting, I feel like the transistor data is a bad example and relies on the presentation of the data.
First, the data presented is log-linear; if you were to put the vertical line before the shoulder of the exponential growth on a linear-linear plot it would emphasize exactly how important photolithography is.
Second, there are only four data points before the vertical line. It not statistically significant to fit an exponential to such a small sample size. The presentation hides how noisy this is. Moreover, if you do a regression on the first 4 points, it suggests we should have at least two-orders of magnitude fewer transistors than we do today.
Does your observation replicate in non-exponential systems?
I want to second and elaborate on this point. Maybe the reason everything looks like lines is because people really really like lines and whenever the data doesn’t look like a line, we change the scales so that it will start looking that way.
I think Moore’s Law, if it were still true, would be driven by the straight line on an exponential graph, which shows the improvements that chip manufacturers need to make in order to make “number of years before you buy another computer” constant over time. Computer prices stay ~ constant WRT inflation, and people buy a new computer after some constant percent improvement; therefore, percent improvement per year must be constant, and absolute improvement per year must be exponential.
I don’t think Moore’s Law is still true in the way people imply it is; nor has it ever been. The cost of chip fabrication facilities has also always increased exponentially. This worked out okay as long as demand for CPUs also increased exponentially, but that stopped sometime after 2000.
Since about 2008, transistors per CPU–on the most-expensive CPUs–has increased much faster than transistors per dollar. Also at that time, clock speed basically stopped increasing. So if you look at the graph on the Wikipedia article for Moore’s Law, you’ll see that (A) the CPUs from before 2008 are consumer models, and the CPUs after 2008 are high-end models that no consumer could afford, and (B) the increase in CPU benchmarks has been slower than in transistors per CPU since about 2008.
The real metric of interest to those looking for synergy in R&D is something like (FLOPS per consumer dollar) per R&D dollar. Moore’s Law gives the illusion that this is exponential by having an exponential increase in units sold per year and clock frequency on the left side of the graph, and an exponential increase in cost per CPU and a flat clock frequency on the right side.
This post prompted me to find Moore’s original 1965 paper (link here for the curious — it’s only 4 pages, easy read), and it didn’t say quite what I thought, so thanks for the prompting.
Moore’s law is about the number of transistors in “a dense integrated circuit” — this is closely related to the number of transitors per unit area you can fit on a Silicon wafer. Moore’s original paper pointed out that the every-year, the cheapest-per-component circuit size increased (see the graph on page 2), and his “law” was extrapolating this trend. This does not necessarily say anything about what that cost will be, either per component or overall. The “Law” definitely held true through 2018 (last time I tried to look into this) although the time-period for doubling has increased (first from 18months to 2 years, in the 70s; and up to 30 months since 2012).
You’re right that people mis-apply or overgeneralize “Moore’s Law” a lot, though — and a lot of popular interpretations are not true or have stopped applying. (The one they brought up in my classes was clock speed — there’s been basically no increase in clocking speed since the mid-2000s, which is why CPUs moved to multi-core designs.)
It’s not driven so much by “making consumers buy another computer” — certainly it couldn’t have been in the first decade or two, when personal computers weren’t even a thing! My understanding is that it’s more a tradeoff on the production side — factories are incredibly expensive to re-tool, so you need to balance how often you upgrade them against other factors.
This seems to be a good time to pull out dear old Bayes.
On one hand, given the priors of “People attempt to avoid behaviors that have recently been made illegal (w/r/t pollution)” and “The US Government enforces laws” it is going to take a lot more than graphs of three* trends with vertical lines showing no visible effect to convince me to lower my expectation that regulation _can_ work.
*The 1990’s Clean Air Act Amendments look like they had a more serious effect on Lead than the three other pollutants that were graphed. My understanding is that the 1990s amendments addressed much more than the four pollutants graphed, including Ozone, for example. Here’s a graph for Ozone, and if you mentally calculate the average amount & slope for all data points before, and all data points after, 1990 it seems like the date of the clean air amendments would be a good candidate for a changepoint.
On the other hand, the same exact trend data in your post could also be used to support the conclusion that the regulations were made by compromise and committee, and that after industry lobbying, the regulations were watered down enough so that they’d get enough votes, by which time the legislation was as close to the trends companies were already committing to without a massive amount of R&D.
And on the other, other hand, I wonder would happen if you took the Y-Axes in all of the graphs shown and divided them by something like the GDP, as well as controlled for other factors relating to globalization. The reason being that these graphed trends of what has happened are just proxies for trying to ascertain what would have happened without the event/legislation, and a lot has happened in the world during the timeframes indicated on the x-axes.
I don’t think that Moore’s law is comparable because chip manufacturers intentionally commit plenty of resources to try to achieve it. (All it takes is one company to lead the way, the others will have to follow if they are to stay competitive.) In fact, Moore’s law should probably be renamed to Moore’s limit. I.e. with limitless financial resources and a state of imperfect knowledge about materials science and integrated circuit design, the pinnacle of collaborative collections of well-developed human brains can only approximately double the number of transistors on a single chip every two years or worse.
The lead line is rather instructive. Lead started being phased out by law in 1973, but the big drop was probably the 1975 requirement of cars which accepted only unleaded gasoline. And there’s no straight line unaffected by the law change there, though the chart doesn’t go back far enough to show the beginning.
Yeah. I’d tend to expect the responses to new laws to look more like a sigmoid than a step function, taking place over years. But that’s from a steady state. No matter how many laws you have you only have so much bureaucratic enforcement you an apply. And at the same time industry only has so much capacity to make changes. So one model would be that you need a certain amount of legal overhang to keep making progress and that progress will eventually level off if the actual situation ever arrives at what the law says it should be.
This seems right to me. Laws have a phase-in time, “Fleetwide average of 40 mpg by 2030” and such, and industries continually adapt to meet that requirement on schedule.
Isn’t the sensible interpretation of the “excimer laser photolithography” graph that while it was part of the contribution to the Moore’s Law progress, it was a very small part?
I mean, we know why laser photolithography earned its keep: despite the considerable expense of developing the technology, creating the fab to use that technology, and the cost of producing CPUs, Intel and friends were able to charge enough for the resulting product to justify the investment. Repeat that a thousand times for a thousand economically justifiable advances in microchips, and you’ve got Moore’s Law.
The counterpoint for the Clean Air Act or OSHA is that if those two considerable bureaucracies, with their considerable costs (both in terms of the institution itself and in terms of the cost of the regulations) made only a laser-photolithography level of difference in their respective fields, weren’t they cost-ineffective?
Because this comparison implies that either OSHA, if cost-effective, represents a tiny fraction of the total cost of the improvements in workplace safety (interesting if true), or that OSHA was wildly and catastrophically ineffective relative to its cost.
(And don’t get me wrong: rah rah improved worker safety, I’m very happy that most industries no longer consider dead workers a routine cost of doing business. But I’m interested in what the other thousand small improvements in worker safety looked like, and if any of them cost anywhere close to what OSHA did. I also don’t reject the possibility they did cost that much: as one example, fire sprinklers are radically effective at stopping people from dying in fires at work, but the cost of that safety is that we mandate expensive fire sprinkler systems in every new building. Once again: rah rah not dying in a fire….)
It could be that once the more low-hanging fruit of anti-pollution efforts has been plucked, more cost-intensive measures are the next most effective option, and while each delivers diminishing marginal returns on its own, the accumulated value over time of air free from pollution makes them cumulatively worth the cost.
In other words, ending all anti-pollution efforts below a certain threshold of cost effectiveness might save you a couple dozen dollars a year on taxes, but the accumulated damage you’ll be doing to you and your children most likely outweigh that cost.
There are some assumptions there though.
One is that the low hanging fruit is actually gone and the existing rules are optimally efficient. That is most unlikely. There have been many examples of rules requiring things like catalytic converters and emissions testing that then create barriers to battery electric vehicles or anything else that doesn’t fit into the expected frame, or merely rules with unnecessary complexity and administrative burdens.
Another assumption is that the last few percent are actually worth the cost. If the costs are indeed exponential then at some point the incremental cost exceeds the incremental benefit, and on an exponential graph it is easy to go well past that point in linear dollars.
And one of the most common mistakes, that yesterday’s trade off is worth it today. Something may cost fifty billion a year and be worth that cost, so you require it, then ten years later someone discovers a way to get the same benefit for ten billion. But the rule requiring the old method is still on the books.
@koboll
Could this be a major contributor to “cost disease”? The more intensive methods tend to pass on high costs, and each field of life that gets costs passed onto it is only able to maintain “straight lines” (or greater) in a positive direction, if it can pass on the costs to some other field. Then at some point it all piles up at the bottom in all the fields that can’t (or aren’t allowed to) pass on the costs anymore, and then we experience that as “cost disease”. You’d get a gradually widening pyramid over time.
Graph the number of workplace accidents per capita on a log curve instead of a linear one. The alleged straight line goes away.
It might be worth considering option 3: the trend line is a biased random walk, the Clean Air Act really did change the bias, but you don’t have enough data to distinguish this from no change.
Obviously this is possible for a sufficiently small change in the bias. But I think it’s actually possible for fairly large changes as well… depending on the underlying model you use. I haven’t done the math, though, so I’ll just say, beware your intuitions here.
Other systems like that with the closed feedback control loop are user interfaces: The response time to a user action remains roughly the same despite the exponential increase in computing power, because the acceptable response time is determined by the human reaction time. So any time the UI takes more processing, the optimizations catches up, so the response time goes back into the acceptable low-tens-of-milliseconds range.
True, except I’d dispute the word ‘acceptable’. I feel like TV menus were unbearably slow for fully a decade, maybe fifteen years, from when they first starting appearing in digital TVs, because they kept adding animations and various crap at the same rate the poor things’ processors were improving. They’ve just started to pull out of it recently, I think.
Something similar seems to be going on with websites at the moment.
Did you pay good money for those TVs? Did you return them and demand a refund because the menu times were too slow? Did you even bother to leave bad reviews on Amazon or wherever?
I’m pretty sure that in any dispute between you and the word ‘acceptable’ over this, ‘acceptable’ wins. And whoever was paid to add those creeping features, thanks you for your tolerance and your cash.
Having never bought a TV, I’m purely bitching about other people’s, here. But taking your point more generally: believe me, I am definitely willing to go out of my way to avoid paying for over-engineered (or over-designed, or whatever) crap, if I can at all avoid it. I just wish anyone else would.
You’re probably right that these things are control systems. However, that doesn’t make the “the Clean Air Act didn’t make any difference” argument wrong! It didn’t make any difference from what would have happened otherwise, in the sense that it did not decrease pollution beyond what would have happened without the Clean Air Act. That’s not the same thing as saying the Clean Air Act had no effect—it very likely did. But that’s not really the interesting question, at least from a libertarian perspective. The question is: Is Federal pollution regulation necessary to decrease pollution? The answer seems to clearly be No.
That doesn’t make sense to me.
It still seems like passing the Clean Air Act was a good idea (assuming you want clean air, that it was a well-designed bill, etc). If they hadn’t passed the Clean Air Act, then they would have had to use less efficient methods to get clean air. If they hadn’t passed the Clean Air Act and had also banned all other plausible methods of getting clean air, then it probably would have broken the control system.
So in what sense is federal pollution regulation not necessary?
There are lots of things that could have been done *instead* of the Clean Air act, that would have had the same *benefits as* the Clean Air act. A G10 Clean Air *treaty* that the US actually cared about, for the most trivial change. Politics is flexible like this. If the control system wants the number to go down, and wants it to happen through politics, there are an unlimited number of political maneuverings that can achieve its purpose.
This is unlike other types of changes. Individual technologies can be a lot more necessary, because you can’t equally substitute another technology. (But inventors can be—the control system’s influence is most of the dynamic behind the “it was time for this invention to come into existence” point-of-view.)
“Politics” itself, as a tool of the control system, might be said to be necessary for it to achieve maximal effect (not “break down.”)
“does the engine make my car move?”
“there’s lots of mechanisms that could have been used to make your car move”
It’s similar to the anti-vaxer charts that show vaccine inventions in the middle of an existing decline in cases of a disease.
There was already a campaign and political will to find measures to deal with the problem, vaccines happen to be a particularly effective, particularly cheap and particularly powerful mechanism for keeping that downward trend going.
And there’s no guarantee that without method X that we could get to where we are now. Without vaccines wiping out smallpox may have been impossible by any politically workable means.
Yes, the question is what other things stopped happening when the vaccine was invented.
Like, maybe “incidence of disease” keeps going down at the same rate, but “families quarantined because the kid got smallpox” goes to near-zero, or “head of cattle destroyed because a herd-mate got TB” goes to near-zero.
Well, yes, the engine makes your car move — but it’s not like you have a choice between the One True Engine or nothing. There is an infinite variety of possible car engines, but nature provides a sort of attractor for them, so they all end up having very similar features.
If I understand correctly, that’s what tsutsifrutsi is saying: there exists a natural attractor (human/political nature counts as “natural”) for measures that reduce air pollution, so if the Clean Air Act didn’t exist, the solution that replaced it would’ve looked similar to it.
Or, the clean air act could have resulted in a less efficient method of reducing pollution. The graphs don’t tell you anything about that either.
I detect a hidden assumption here: that the Clean Air Act was the most efficient possible method. Didn’t see any argument to that effect. Certainly don’t believe it as an axiom.
Yeah, I think it would have been better phrased “other methods” not “less efficient”. Those methods might have been better, worse, or the same. According to this premise, though, if they were worse then additional changes would have been demanded to keep the improvement trend going, and if it had been better there would have been diluted demand for improvement and less would have been done in the future leading to the same outcome (assuming I’m roughly understanding this concept correctly).
The Clean Air Act wasn’t necessarily, or probably, the single best method for reducing air quality possible. But if there had been some obviously better politically palatable method for improving air quality, that would probably have been proposed first. If the Clean Air Act had failed to pass in Congress, measures proposed after it would probably have been more limited, not more extensive, and if good measures were available which needed no political control to implement, the Clean Air Act should not have prevented those from being applied as well.
I guess it’s so obvious that nobody even needs to bother to claiming it that the only possible route to cleaner air was Federal legislation. Oh well.
I must have missed the news when Congress passed Moore’s Law.
Customers are willing to pay for more computing power…
Sure. And evidently they are willing to vote for cleaner air, which costs them something at least indirectly.
If you want, feel free to bring in notions like prisoner’s dilemma and tragedy of the commons, and I won’t argue with you.
Still, if the Federal government in the late 20th century had suddenly developed a conscience and said, “Air pollution is bad, but we have no Constitutional authority to address it,” do you suppose states and cities might possibly have taken up the slack? Or that citizens having trouble breathing might have started picketing the most egregious offenders, or deserting towns whose titans of industry refused to clean up the smokestacks or effluents?
People buy lots of hybrids and electric cars now despite being under no compulsion to do so (yes, I think there are still subsidies for electrics, which makes the marginal buyer a little more likely to go that way). Partly that’s the desire to make an upfront investment for lower running expenses, but partly it’s just that the zeitgeist says it’s a virtuous thing to do.
You’re welcome to scoff that what I’m talking about is a bunch of half-measures and obviously less efficient than the Clean Air Act. You might even be right. What I found so interesting was the seeming unawareness that it was even a question.
Indeed, I already pointed out that one of the flaws in the basic analysis Scott is making is that the (amendment to the) Clean Air Act is not a singular event and that the very first air pollution regulation was a municipal one enacted in 1890. The fact that cities and states may act does not contradict the idea that a federal regulation may be effective and necessary. Air pollution does not have the pleasing property of only effecting emitters.
Yes, some customers are willing to pay for cleaner vehicles. If we get lucky and cheap fusion power becomes a thing, then the market will solve (much of) the problem for us. But absent that, the broad market is under no compunction to provide a solution because cleaner cars provide no primary utility for the purchaser. And even with cheap fusion power, if there is enough primary utility to be gained by using an electric vehicle that pollutes in some manner, we will see polluting electric vehicles.
This is the basic difference between Moore’s law and pollution controls. It is driven by the markets desire for the primary utility of the computing power. You bringing in Moore’s law as if it somehow applies to pollution controls is specious.
This isn’t true, a car that gets 35 mpg is cleaner (all else equal) than a car that gets 30 mpg, and provides a primary utility for the purchaser.
There are almost always (absent conspicuous consumption) benefits to producing cleaner cars to the purchaser, we don’t have masses of electric cars right now because the costs of producing cleaner cars far outweighs those benefits, not because those benefits don’t exist.
Incentives/disincentives for Tesla to annually sell millions of cars would almost certainly* be worse, not better, for environmental externalities on net.
*The main exception being if you consider CO2 production to be so much worse than any other externality.
For some definitions of “cleaner”, and all else is rarely equal. This is one area where the collapsing of all environmental concerns into Climate Change and measuring all environmental threats by carbon footprint alone, only confuses the issue.
If you have a car that gets 30 mpg and would rather it get 35 mp, the one simple obvious thing to do to make that happen (and really, probably get to 40 mpg and with the corresponding reduction in carbon footprint) is to replace the gasoline engine with a diesel. Go talk to the folks at Volkswagen about how that makes the car “cleaner”.
@John Schilling:
And even that isn’t quite as good as it seems, from a carbon footprint perspective, as diesel has more carbon per gallon. 15% IIRC.
15% only if you’re comparing to the most heavily oxygenated gasoline blends like E85. Only 8% for diesel vs. straight unleaded gasoline.
Nor did I claim it did. My objection was to the unspoken assumption that federal regulation was a priori the most efficient solution, reducing the problem to choosing between the Clean Air Act or some other federal action.
You’re free to argue that this assumption is true — though so far I haven’t heard you do so. Instead, you have argued that my raising the question doesn’t prove that a non-federal solution would be better. Perfectly true, and I would be silly to disagree.
Dude.
The post you responded to literally started with “The Clean Air Act wasn’t necessarily, or probably, the single best method for reducing air quality possible.”
Yeah, and then it contrasted it with hypothetical alternative Congressional acts, and then asserted (contrary to historical evidence) that aggressive federal action does not put a damper on other approaches. But whatever.
Federal pollution regulation isn’t necessary for lowered air pollution, a trend of lowering air pollution implies federal regulations.
Because the goal of lowered air pollution is powerful enough to lower air pollution, and getting federal regulations passed is easier than other methods.
If they hadn’t passed the Clean Air Act, then they would have had to use less efficient methods to get clean air
This assumes CAA is the most efficient way of cleaning air that is possible. Of course, with this assumption the argument that it doesn’t matter looks stupid. The opponents of CAA are questioning exactly this assumption – that CAA in particular and federal regulation in general are the most efficient methods of achieving the goal (especially taking into account the costs involved). If you ignore this criticism and presuppose the very thing they are trying to disprove, of course it wouldn’t make sense for you!
Of course, there’s another part of libertarian criticism of Federal regulation – as libertarians consider government coercion immoral, if there existed two absolutely equally efficient ways of achieving the same goal for the same cost – CAA and non-coercive method – the CAA way would still be inferior for moral grounds and the other way should be preferred. This would be the argument if you cleared the hurdle of proving that CAA is at least as efficient as non-CAA method, taking costs into account. But I don’t think you even did that – you just assumed it’s already true.
Perhaps one in which those afflicted by your pollution are allowed to sue you into the poor house?
It’s a libertarian argument, and one that I don’t really hold to much anymore, but there it is.
How do you know the graph would continue to trend downwards without the Clean Air Act? That seems to be the entire point of Scott’s post.
It would be a weird coincidence if the trend just stopped that year.
An ambitious scientist could compare the curves in jurisdictions without the US Clean Air Act, but I am not that scientist.
You could say the same thing about the Moore’s Law graph, that’s the point.
The obviously true answer to any “how do you know where the graph would have continued” question is that nobody knows.
So we’re all just speculating. That was my point.
It wouldn’t “just stop”, but there are lots of trends that eventually plateau.
In fact, probably every trend eventually plateaus. And maybe the reduction in air pollution wouldn’t have platueaued (eh… sorry spell check) then without the law, but would have leveled off earlier than it otherwise did.
That seems the most reasonable case to me, although that still doesn’t tell us whether the act was then worth passing.
The only reason it didn’t make any difference from what would have happened otherwise is that the Clean Air Act would have happened otherwise. “If the Clean Air Act did not exist, it would have been necessary to invent it”, as Voltaire says.
The regulatory standards for the four pollutants in the first figure were set in the 1970s (the clean air act was in 1970… 1990 was the second clean air act amendment). The concentrations of those 4 pollutants were dropping because of the regulation set earlier. the 1990 clean air act amendments did not change the regulatory standards for those four pollutants, so it is a misleading figure.
Here is a history of the concentration standards for the 4 pollutants.
SO2: https://www3.epa.gov/ttn/naaqs/standards/so2/s_so2_history.html
CO: https://www.epa.gov/co-pollution/table-historical-carbon-monoxide-co-national-ambient-air-quality-standards-naaqs
Lead: https://www3.epa.gov/ttn/naaqs/standards/pb/s_pb_history.html
NO2: https://www3.epa.gov/ttn/naaqs/standards/nox/s_nox_history.html
This comment is one of the very few time I want upvotes.
More to the point, and to amplify what Scott is saying as well as address some missing points, the Clean Air Act was not a single, unusual act, nor did it create immediate, across the board, change. Various municipal, state and national air pulltion regulations began as early as 1890. Frequently air pollution regulations prevent the installation or sale of new non-compliant devices while leaving in place existing ones.
Given those kinds of regulations, slow, incremental progress is what we would expect to see, rather than sharp discontinuities.
Yes, the 1990 Amendment was just one of many bills. One shouldn’t expect it to be a big turning point.
But you are completely wrong to say that it addressed new pollutants and is irrelevant to the graph. It had several topics. Some of them are irrelevant to the graph, but the biggest was acid rain, which was about NO₂ and SO₂, 2/4 pollutants graphed! It did introduce lots of specific tools for dealing with them.
You link to “standards” but standards don’t enforce themselves. Changing standards for air pollution are not particularly important in actually producing change. Just because someone says that something is “unacceptable” doesn’t mean that they don’t accept it. It’s one thing to set a standard for factory outflow, where the factory is responsible, but if you say that the air pollution in a particular place is unacceptable, that doesn’t have any effect until you decide whom to hold responsible. The 1990 bill actually did things, like, eg, cap and trade, which were relevant to producers.
Excellent point about the history of regulation of air pollution. Workplace safety is a little different, in that lower accident rates are economically beneficial to companies as well as workers. Fatality rates in sectors like mining have been declining for centuries, and track economic growth and increases in the economic value of human life. If environmental regulation went away, there would be a lot more pollution. I doubt that there would be more dangerous workplaces if OSHA/MSHA went away.
I think that almost every workplace that is only compliant with safety regulations because OSHA has fined them for being non-compliant would revert. Those that would continue to comply would be more than outnumbered by the number that only ever complied so that OSHA wouldn’t initiate enforcement actions.
See https://www.osha.gov/topcases/bystate.html for a breadth of those cases.
I do acknowledge the argument that many things which are OSHA violations are not actually unsafe. I accept that it is technically true, while also asserting that someone who has installed railings that are not the regulatory required height likely also has not done their due diligence on other things; compare the brown M&M story.
In the case of workplace safety as well as clean air it is technology and procedural progress that leads to improvements, hence any legislation there only sets in stone what is otherwise already a reality and implementable or available anyway. The thing that actually drives the linear trend simply isn’t on the chart. You chose to look at policy when you should have looked at technological and organizational innovation. In the case of transistors and semiconductor technology, the technology itself is the very thing that leads to the linear (albeit logarithmical) trend. There is probably hundreds of subsidy packages, innovation programmes and government initiatives that you could plot along the x axis, it still wouldn’t change the fact that what affects the outcome is something else.
Of course, I see things this way because I don’t believe in a successful planning of the economy. If you think the other way round is possible, for me you are making the mistake of believing in the wrong political philosophy and not a faulty assessment of causality. Because I say legislation tends to follows paradigms as well as technological availability. How good you think one can be as a policy maker to pick the winners to propel the line forward is hence a function of your political convictions.
Due to working memory constraints, the humans are fond of calling models with between 0 and 3 factors controlling most of the observed variance ‘reality.’
This seems like the sort of thing Judea Pearl’s causal models are built to address.
Pearl’s book is largely useless for actually doing anything; everything he does starts by positing a true causal graph, presumably from divine sources. Rex Kline has a usable book on actually doing causal inference and comparing different models and is much more realistic about what is possible. Angrist and Pischke is also good.
Insofar as the point is: that you need causal models before you can do causal inference: exactly.
>How do we tell the difference between this world, and the world where the Clean Air Act really doesn’t matter? I’m not sure (does anyone know of research on this?). Maybe this is one of those awful situations where you have use common sense instead of looking at statistics.
You could probably exploit international variation in the timing of legislation…Here’s a paper that deals with a similar-ish situation: anti-smoking policies.
@scott in a old post .. which i cannot recall… you mentioned a worrying paradox/syndrome.. which i cannot recall.. please help:
It was along the lines of any subject you know about, when you read about it, you know that most people haven’t a clue what they are talking about, when talking about that subject. But then in the same realms of popular culture/media/literature you will read about some other topic and take it on perfectly good faith that this is an accurate description of what is being written about. I think you said a physicist (or two) came up with the name/were named after the description of this idea. It’s been annoying me for like 1.5 months that I can’t recall now I just give up and must seek outside help to get the name..
Thanks
Gell-Mann Amnesia.
Spending time around news industry types dissauded me from believing that anyone in that industry has the slightest fucking clue about anything at all.
PS: They’re also uniformly lazy.