
[Epistemic status: I am basing this on widely-accepted published research, but I can’t guarantee I’ve understood the research right or managed to emphasize/believe the right people. Some light editing to bring in important points people raised in the comments.]
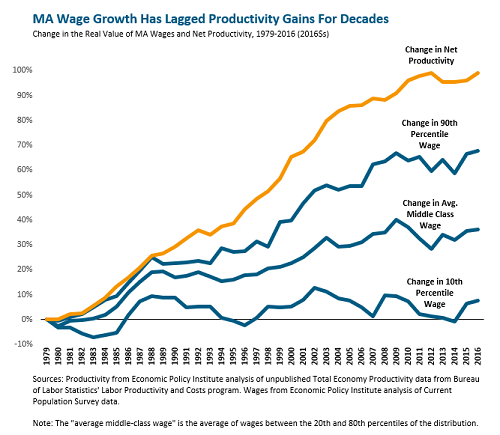
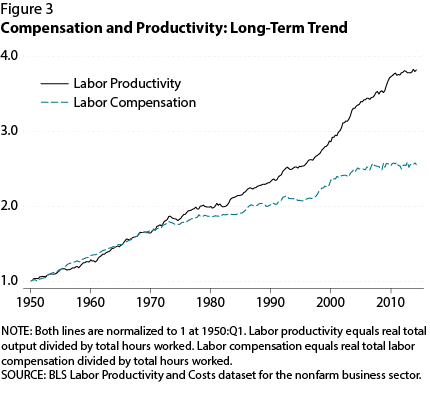
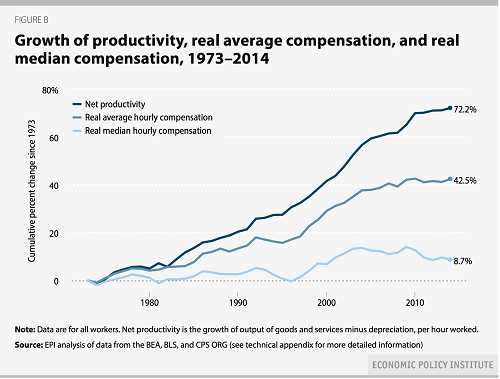
You all know this graph:
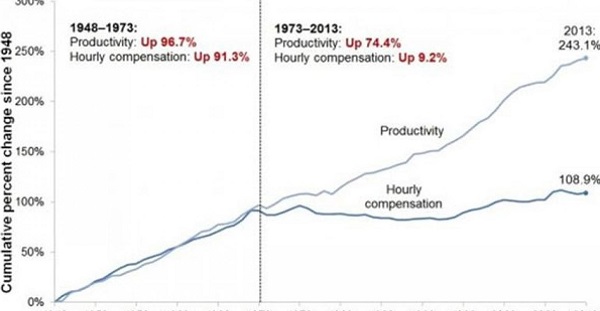
Median wages tracked productivity until 1973, then stopped. Productivity kept growing, but wages remained stagnant.
This is called “wage decoupling”. Sometimes people talk about wages decoupling from GDP, or from GDP per capita, but it all works out pretty much the same way. Increasing growth no longer produces increasing wages for ordinary workers.
Is this true? If so, why?
1. What Does The Story Look Like Across Other Countries And Time Periods?
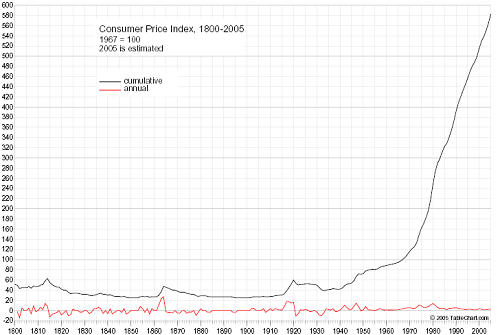
Here’s a broader look, from 1800 on:
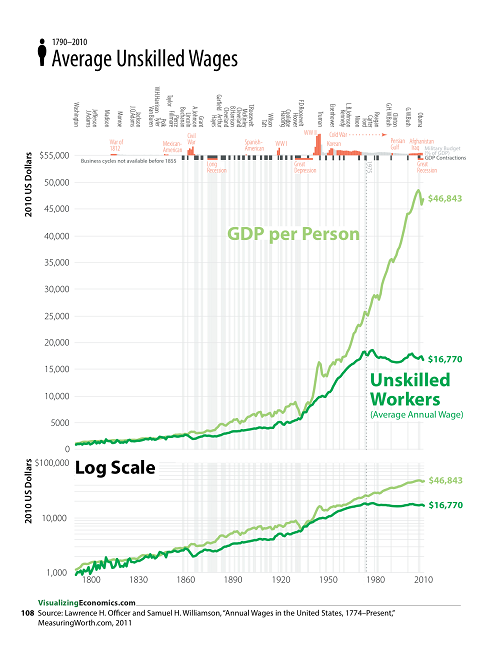
It no longer seems like a law of nature that productivity and wages are coupled before 1973. They seem to uncouple and recouple several times, with all the previous graphs’ starting point in 1950 being a period of unusual coupledness. Still, the modern uncoupling seems much bigger than anything that’s happened before.
What about other countries? This graph is for the UK (you can tell because it spells “labor” as “labour”)
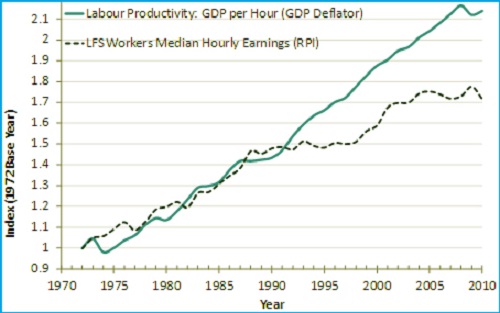
It looks similar, except that the decoupling starts around 1990 instead of around 1973.
And here’s Europe:
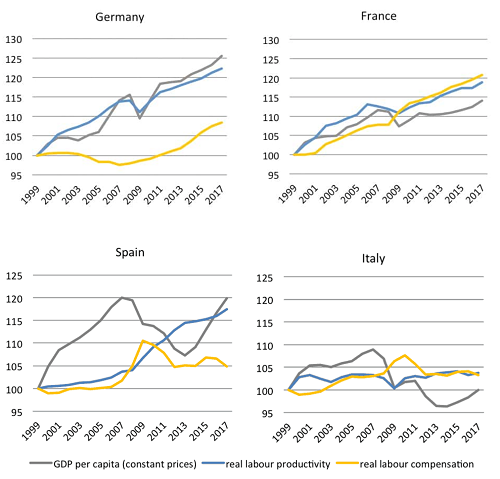
This is only from 1999 on, so it’s not that helpful. But it does show that even in this short period, France remains coupled, Germany is decoupled, Spain is…doing whatever Spain is doing, and Italy is so pathetic that the problem never even comes up. Overall not sure what to think about these.
2. Could Apparent Wage Decoupling Be Because Of Health Insurance?
Along with wages, workers are compensated in benefits like health insurance. Since health insurance has skyrocketed in price, this means total worker compensation has gone up much more than wages have. This could mean workers are really getting compensated much more, even though they’re being paid the same amount of money. This view has sometimes been associated with economist Glenn Hubbard.
There are a few lines of argument that suggest it’s not true.
First, wage growth has been worst for the lowest-paid workers. But the lowest-paid workers don’t usually get insurance at all.
Second, the numbers don’t really add up. Median household income in 1973 was about $48,000 in today’s dollars. Since then, productivity has increased by between 70% and 140% (EVERYBODY DISAGREES ON THIS NUMBER), so if median income had kept pace with productivity it should be between $82,000 and $115,000. Instead, it is $59,000. So there are between $23,000 and $67,000 of missing income to explain.
The average health insurance policy costs about $7000 per individual or $20000 per family, of which employers pay $6000 and $14000 respectively. But as mentioned above, many people do not have employer-paid insurance at all, so the average per person cost is less than that. Usually only one member of a household will pay for family insurance, even if both members work; sometimes only one member of a household will buy insurance at all. So the average cost of insurance to a company per employee is well below the $6000 to $14000 number. If we round it off to $6000 per person, that only explains a quarter of the lowest estimate of the productivity gap, and less than a tenth of the highest estimate. So it’s unlikely that this is the main cause.
Third, some people have tried measuring productivity vs. total compensation, with broadly similar results:
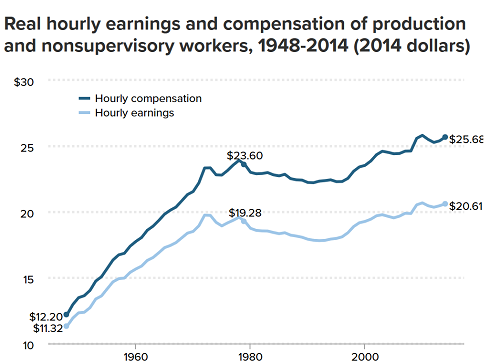
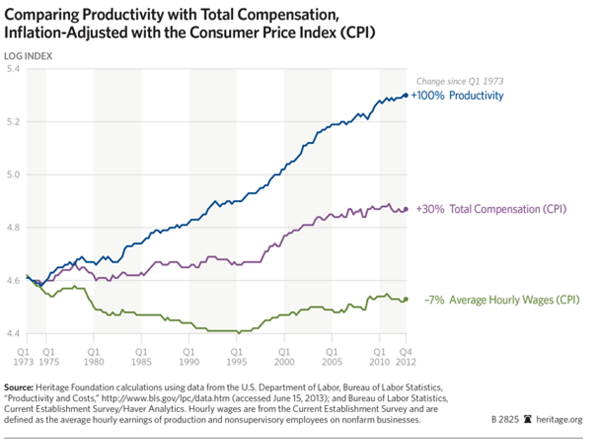
The first graph is from the left-wing Economic Policy Institute, whose bias is towards proving that wage stagnation is real and important. The second graph is from the right-wing Heritage Foundation, whose bias is towards proving that wage stagnation is fake and irrelevant. The third graph is from the US Federal Reserve, a perfectly benevolent view-from-nowhere institution whose only concern is the good of the American people. All three agree that going from earnings to total compensation alone closes only a small part of the gap. The EPI also mentions that most of the difference between earnings and compensation opened up in the 1960s and stayed stable thereafter (why? haven’t health insurance costs gone up more since then), which further defeats this as an explanation for post-1973 trends.
We shouldn’t dismiss this as irrelevant, because many things that close only a small part of the gap may, when added together, close a large part of the gap. But this doesn’t do much on its own.
3. Could Apparent Wage Decoupling Be An Artifact Of Changing Demographics?
The demographics of the workforce have changed a lot since 1973; for example, more workers are women and minorities. If women and minorities get paid less, then as more of them enter the workforce, the lower “average” wages will go (without any individual getting paid less). If they gradually enter the workforce at the same rate that wages are increasing, this could look like wages being stagnant.
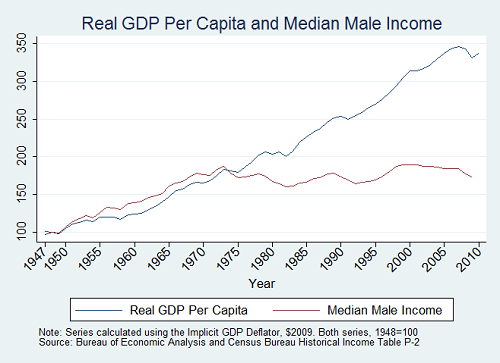
But if we disaggregate statistics by race and gender, we don’t see this. Here’s average male wage over the relevant time period:
And here’s average income disaggregated by race:
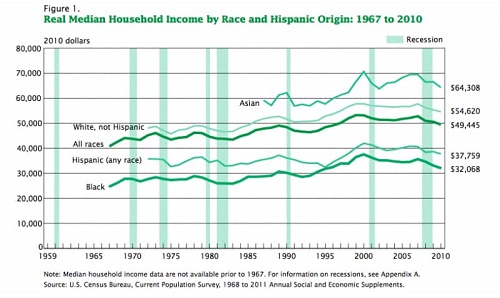
The patterns for whites and men are the same as the general pattern.
There is one unusual thing in this area. Here’s the pattern for women:
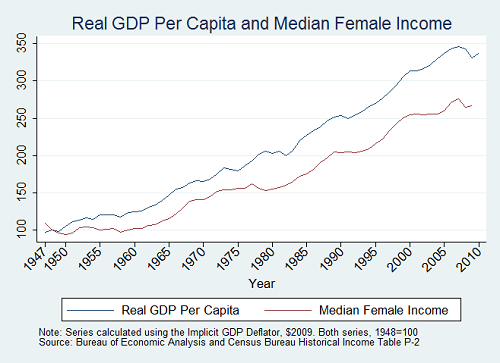
Women’s income is rising at almost the same rate as productivity! This is pretty interesting, but as far as I can tell it’s just because women’s career prospects have been improving over time because of shifting cultural attitudes, affirmative action, and the increasing dominance of female-friendly service and education-heavy jobs. I’m not sure this has any greater significance.
Did increased female participation in the workforce increase the supply of labor and so drive the price of labor down? There’s a tiny bit of evidence for that in the data, which show female workforce participation started rising much faster around 1973, with a corresponding increase in total workforce. But this spurt trailed off relatively quickly, and female participation has been declining since about 2000, and the wage stagnation trend continues. I don’t want to rule out the possibility that this was part of what made 1973 in particular such a strong inflection point, but even if it was, it’s long since been overwhelmed by other factors.
4. Could Apparent Wage Decoupling Be An Artifact Of How We Measure Inflation?
Martin Feldstein is a Harvard economics professor, former head of the National Bureau of Economic Researchers, former head of the President’s Council of Economic Advisors, etc. He believes that apparent wage stagnation is an artifact of mismeasurement.
His argument is pretty hard for me to understand, but as best I can tell, it goes like this. In order to calculate wage growth since 1973, we take the nominal difference in wages, then adjust for inflation. We calculate wage inflation with something called the Consumer Price Index, which is the average price of lots of different goods and services.
But in order to calculate productivity growth since 1973, we use a different index, the “nonfarm business sector output price index”, which is based on how much money companies get for their products.
These should be similar if consumers are buying the same products that companies are making. But there can be some differences. For example, if you’re looking at US statistics only, then some businesses may be selling to foreign markets with different inflation rates, and some consumers may be buying imported goods from countries with different inflation rates. Also (and I’m not sure I understand this right), if people own houses, CPI pretends they are paying market rent to avoid ignoring housing costs, but PPI doesn’t do this. Also, PPI is not as good at including services as CPI. So consumer and producer price indexes differ.
In fact, consumer inflation has been larger than producer inflation since 1973. So when we adjust wages for consumer inflation, they go way down, but when we adjust productivity for producer-inflation, it only goes down a little. This means that these different inflation indices make it look like productivity has risen much faster than wages, but actually they’ve risen the same amount.
As per Feldstein:
The level of productivity doubled in the U.S. nonfarm business sectorbetween 1970 and 2006. Wages, or more accurately total compensation per hour, increased at approximately the same annual rate during that period if nominal compensation is adjusted for inflation in the same way as the nominal output measure that is used to calculate productivity.
More specifically, the doubling of productivity represented a 1.9 percent annual rate of increase. Real compensation per hour rose at 1.7 percent per year when nominal compensation is deflated using the same nonfarm business sector output price index. In the period since 2000, productivity rose much more rapidly (2.9 percent ayear) and compensation per hour rose nearly as fast (2.5 percent a year).
Why is the CPI increasing so much faster than business-centered inflation indices?
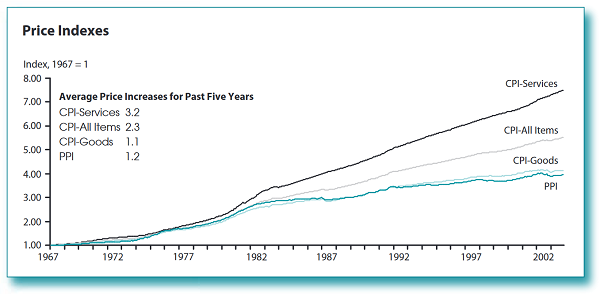
The Federal Reserve blames tech. The services-centered CPI has comparatively little technology. The goods-heavy PPI (a business-centered index of inflation) has a lot of it. Tech is going down in price (how much did a digital camera cost in 1990? How about now?) so the PPI stays very low while the CPI keeps growing.
How much does this matter?
The left-leaning Economic Policy Institute says it explains 34% of wage decoupling:
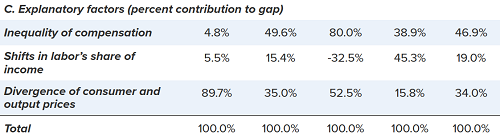
The right-leaning Heritage Foundation says it explains more:
If we estimate the size of the gap as 70 pp (between total compensation CPI and productivity), switching to the top IPD measure closes 67% of the gap; switching to the PCE measure explains 37% of the gap. I’m confused because the EPI is supposedly based on Mishel and Gee, who say they have used the GDP deflator, which is the same thing as the IPD which the Heritage Foundation says they use. I think the difference is that Mishel and Gee haven’t already applied the change from wages to total compensation when they estimate percent of the gap closed? But I’m not sure.
One other group has tried to calculate this: Pessoa and Van Reenan: Decoupling Of Wage Growth And Productivity Growth? Myth And Reality. According to a summary I read, they believe 40% of wage decoupling is because of these inflation related concerns, but I have trouble finding that number in the paper itself.
And the CBO looks into the same issue. They’re not talking about it relative to productivity, but they say that technical inflation issues mean that the standard wage stagnation story is false, and wages have really grown 41% from 1979 – 2013. Since productivity increased somewhere between 70% and 100% during that time, this seems similar to some of the other estimates – inflation technicalities explain between 1/3 and 2/3 of the problem.
Everyone I read seems to agree this issue exists and is interesting, but I’m not sure I entirely understand the implications. Some people say that this completely debunks the idea of wage decoupling and it’s actually only half or a third what the raw numbers say. Other people seem to agree that a big part of wage decoupling is these inflation technicalities, but suggest that although they have important technical implications, if you want to know how the average worker on the street is doing the CPI is still the way to go.
Superstar economist Larry Summers (with Harvard student Anna Stansbury) comes the closest to having a real opinion on this here:
When investigating consumers’ experienced rise in living standards as in Bivens and Mishel (2015), a consumer price deflator is appropriate; however, as Feldstein (2008) argues, when investigating factor income shares a producer price deflator is more appropriate because it reflects the real cost to firms of employing workers.
I am a little confused by this. On the one hand, I do want to investigate consumers’ experienced rise (or lack thereof) in living standards. This is the whole point – the possibility that workers’ living standards haven’t risen since 1973. But most people nowadays work in services. If you deflate their wages with an index used mostly for goods, are you just being a moron and ensuring you will be inaccurate?
Summers and Stansbury continue:
Lawrence (2016) analyzes this divergence more recently, comparing average compensation to net productivity, which is a more accurate reflection of the increase in income available for distribution to factors of production. Since depreciation has accelerated over recent decades, using gross productivity creates a misleadingly large divergence between productivity and compensation. Lawrence finds that net labor productivity and average compensation grew together until 2001, when they started to diverge i.e. the labor share started to fall. Many other studies also find a decline in the US labor share of income since about 2000, though the timing and magnitude is disputed (see for example Grossman et al 2017, Karabarbounis and Neiman 2014, Lawrence 2015, Elsby Hobijn and Sahin 2013, Rognlie 2015, Pessoa and Van Reenen 2013).
If I intepret this correctly, it looks like it’s saying that the real decoupling happened in 2000, not in 1973. I see a lot of papers saying the same thing, and I don’t understand where they’re diverging from the people who say it happened in 1973. Maybe they’re using Feldstein’s method of calculating inflation? I think this must be true – if you look at the Heritage Foundation graph above, “total compensation measured with Feldstein’s method” and productivity are exactly equal to their 1973 level in 2000, but diverge shortly thereafter so that today compensation has only grown 77% compared to productivity’s 100%.
Nevertheless, Summers and Stansbury go on to give basically exactly the same “Why have wages been basically stagnant since 1973? Why are they decoupled from productivity?” narrative as everyone else, so it sure doesn’t look like they think any of this has disproven that. It looks like maybe they think Feldstein is right in some way that doesn’t matter? But I don’t know enough economics to figure out what that way would be. And it looks like Feldstein believes his rightness matters very much, and other economists like Scott Sumner seem to agree. And I cannot find anyone, anywhere, who wants to come out and say explicitly that Feldstein’s argument is wrong and we should definitely measure wage stagnation the way everyone does it.
My conclusions from this section, such as they are, go:
1. Arcane technical points about inflation might explain between 33% and 66% of the apparent wage stagnation/decoupling.
2. “Explain” may not mean the same as “explain away”, and it’s not completely clear how these points relate to anything we care about
5. Could Wage Decoupling Be Explained By Increasing Labor-Vs-Capital Inequality?
Economists divide inequality into two types. Wage inequality is about how much different wage-earners (or salary-earners, here the terms are used interchangeably) make relative to each other. Labor-vs-capital inequality is about how much wage earners earn vs. how much capitalists get in profits. These capitalists are usually investors/shareholders, but can also be small business owners (or, sometimes, large business owners). Since tycoons like Jeff Bezos and Mark Zuckerberg get most of their compensation from stocks, they count as “capitalists” even if they are paid some token salary for the work they do running their companies.
Here is the labor-vs-capital split for the US over the relevant time period; note the very truncated vertical axis:
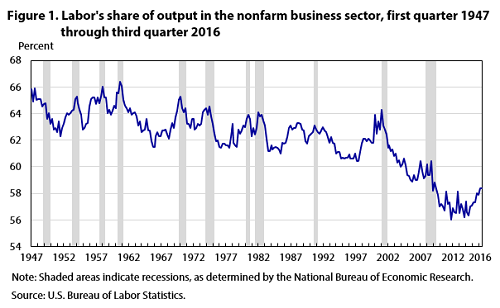
This type of inequality was about the same in the early 1970s as in the early 2000s, and has no clear inflection point around 1973, so it probably didn’t start this trend off. But it did start seriously decreasing around 2000, the same time people who use the more careful inflation methodology say wages and productivity really decoupled. And obviously labor getting less money in general is the sort of thing that makes wages go down.
Why is labor-vs-capital inequality increasing? For the long story, read Piketty (my review, highlights, comments). But the short story includes:
Today’s wage inequality is tomorrow’s labor-vs-capital inequality. If some people get paid more than others, they can invest, their savings will compound, and they will have more capital. As wage inequality increases (see below), labor-vs-capital inequality does too.
The tech industry is more capital-intensive than labor-intensive. For example, Apple has 100,000 employees and makes $250 billion/year, compared to WalMart with 2 million employees and $500 billion/year – in other words, Apple makes $2.5 million per employee compared to Wal-Mart’s $250,000. Apple probably pays its employees more than Wal-Mart does, but not ten times more. So more of Apple’s revenue goes to capital compared to Wal-Mart’s. As tech becomes more important than traditional industries, capital’s share of the pie goes up. This is probably a big reason why capital has been doing so well since 2000 or so.
There’s an iconoclastic strain of thought that says most of the change in labor-vs-capital is just housing. Houses count as capital, so as housing costs rise, so does capital’s share of the economy. Read Matt Ronglie’s work (paper, summary, Voxsplainer) for more. Since houses are neither involved in corporate productivity nor in wages, I’m not sure how this affects wage-productivity decoupling if true.
Whatever the cause, the papers I read suggest that increasing labor-vs-capital inequality explains maybe 10-20% of of decoupling, almost all concentrated in the 2000 – present period.
6. Could Wage Decoupling Be Explained By Increasing Wage Inequality?
The other part of the two-pronged inequality picture above. This one seems more important.
One way economists look at this is in the difference between the median wage and the average wage:
Add in the other things we talked about – the health insurance, the inflation technicalities, the declining share of labor – and the “””average””” worker is doing almost as well as they were in 1973. In fact, this is almost tautologically true. If the entire pie is growing by X amount, and labor’s relative share of the pie is staying the same, then labor should be getting the same absolute amount, and (ignoring changes in the number of laborers) the average laborer should get the same amount.
So the decline in median wage is a mean vs. median issue. A few high-earners are taking a lot of the pie, keeping the mean constant but lowering the median. How high?

Remember, productivity has grown by 70-100% through this period. So even though the top 5% have seen their incomes grow by 69%, they’re still not growing as fast as productivity. The top 1% have grown a bit faster than productivity, although still not that much. The top 0.1% are doing really well.
This is generally considered the most important cause of wage stagnation and wage decoupling, other than among the iconoclasts who think the inflation issues are more important. Above, I referred to a few papers that tried to break down the importance of each cause. EPI thinks wage inequality explains 47% of the problem. Pessoa and Van Reenen think it explains more like 20% according to Mishel’s summary (my eyeballing of the paper suggests more like 33%, but I am pretty uncertain about this).
7. Is Wage Inequality Increasing Because Of Technology?
Here’s one story about why wage inequality is increasing.
In the old days, people worked in factories. A slightly smarter factory worker might be able to run the machinery a little better, or do something else useful, but in the end everyone is working on the same machines.
In the modern economy, factory workers are being replaced by robots. This creates very high demand for skilled roboticists, who get paid lots of money to run the robots in the most efficient way, and very low demand for factory workers, who need to be retrained to be fast food workers or something.
Or, in the general case, technology separates people into the winners (the people who are good with technology and who can use it to do jobs that would have taken dozens or hundreds of people before) and the losers (people who are not good with technology, and so their jobs have been automated away).
From an OECD paper:
Common explanations for increased wage inequality such as skill-biased technological change and globalisation cannot plausibly account for the disproportionate wage growth at the very top of the wage distribution. Skill-biased technological change and globalisation may both raise the relative demand for high-skilled workers, but this should be reflected in broadly rising relative wages of high-skilled workers rather than narrowly rising relative wagesof top-earners. Brynjolfsson and McAfee (2014) argue that digitalisation leads to “winner-takes-most” dynamics, with innovators reaping outsize rewards as digital innovations are replicable at very low cost and have a global scale. Recent studies provide evidence consistent with “winner-take-most” dynamics, in the sense that productivity of firms at the technology frontier has diverged from the remaining firms and that market shares of frontier firms have increased (Andrews et al., 2016). This type of technological change may allow firms at the technology frontier to raise the wages of its key employees to “superstar” levels.
It…sounds like they’re saying that technological change can’t be the answer, then giving arguments for why the answer is technological change.
I think this is just the authors’ poor writing skills, and that the real argument is less confusing. The Huffington Post is surprisingly helpful, describing it as:
What this means is that skilled professionals are not just winning out over working class stiffs, but the richest of the top 0.01 percent are winning out over the professional class as a whole.
That Larry Summers paper mentioned before becomes relevant here again. It argues that wages and productivity are not decoupled – which I know is a pretty explosive thing to say three thousand words in to an essay on wage decoupling, but let’s hear him out.
He argues that apparent decoupling between productivity and wages could result either from literal decoupling – that is, none of the gains of increasing productivity going to workers – or from unrelated trends – for example, increasing productivity giving workers an extra $1000 at the same time as something else causes workers to lose $1000. If a company made $1000 extra and the boss pocketed all of it and didn’t give workers any, that would be literal decoupling. If a company made $1000 extra, it gave workers $1000 extra, but globalization means there’s less demand for workers and so salaries would otherwise have dropped by $1000, so now they stay the same, that’s an unrelated trend.
Summers and Stansbury investigate this by seeing if wages increase more during the short periods between 1973 and today when productivity is unusually high, and if they stagnate more (or decline) during the short periods when it is unusually low. They find this is mostly true:
We find substantial evidence of linkage between productivity and compensation: Over 1973–2016, one percentage point higher productivity growth has been associated with 0.7 to 1 percentage points higher median and average compensation growth and with 0.4 to 0.7 percentage points higher production/nonsupervisory compensation growth.
S&S are very careful in this paper and have already adjusted for health insurance issues and inflation calculation issues. They find that once you adjust for this, productivity and wages are between 40% and 100% coupled, depending on what measure you use. (I don’t exactly understand the difference between the two measures they give; surely taking the median worker is already letting you consider inequality and you shouldn’t get so much of a difference by focusing on nonsupervisory workers?) As mentioned before, they finds the coupling is much less since 2000. They also find similar results in most other countries: whether or not those countries show apparent decoupling, they remain pretty coupled in terms of actual productivity growth:wage growth correlation.
They argue that if technology/automation were causing rising wage inequality or rising labor-capital inequality, then median wage should decouple from productivity fastest during the periods of highest productivity growth. After all, productivity growth represents the advance of labor-saving technology. So periods of high productivity growth are those where the most new technology and automation are being deployed, so if this is what’s driving wages down, wages should decrease fastest during this time.
They test this a couple of different ways, and find that it is false before the year 2000, but somewhat true afterwards, mostly through labor-capital inequality. They don’t really find that technology drives wage inequality at all.
I understand why technology would mean decoupling happens fastest during the highest productivity growth. But I’m not sure I understand what they mean when they say there is no decoupling and productivity growth translates into wage growth? Shouldn’t this disprove all posited causes of decoupling so far, including policy-based wage inequality? I’m not sure. S&S don’t seem to think so, but I’m not sure why. Overall I find this paper confusing, but I assume its authors know what they’re doing so I will accept its conclusions as presented.
So it sounds like, although technology probably explains some top-10% people doing moderately better than the rest, it doesn’t explain the stratospheric increase in the share of the 1%, which is where most of the story lies. I would be content to dismiss this as unimportant, except that…
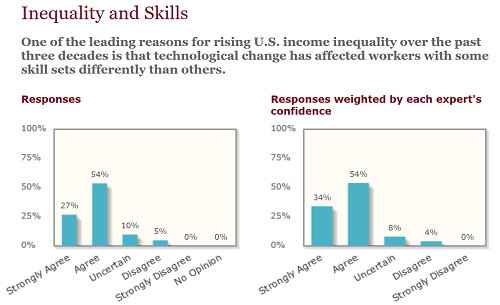
…all the world’s leading economists disagree.
Maybe when they say “income inequality”, they’re talking about a more intuitive view of income inequality where some programmers make $150K and some factory workers make $30K and this is unequal and that’s important – even though it is not related to the larger problem of why everybody except the top 1% is making much less than predicted. I’m not sure.
I feel bad about dismissing so many things as “probably responsible for a few percent of the problem”. It seems like a cop-out when it’s hard to decide whether something is really important or not. But my best guess is still that this is probably responsible for a few percent of the problem.
8. Is Wage Inequality Increasing Because Of Policy Changes?
Hello! We are every think tank in the world! We hear you are wondering whether wage inequality is increasing because of policy changes! Can we offer you nine billion articles proving that it definitely is, and you should definitely be very angry? Please can we offer you articles? Pleeeeeeeeaaase?!
Presentations of this theory usually involve some combination of policies – decreasing union power, low minimum wages, greater acceptance of very high CEO salary – that concentrate all gains in the highest-paid workers, usually CEOs and executives.
I have trouble making the numbers add up. Vox has a cute thought experiment here where they imagine the CEO of Wal-Mart redistributing his entire salary to all Wal-Mart workers equally, possibly after having been visited by three spirits. Each Wal-Mart employee would make an extra $10. If the spirits visited all top Wal-Mart executives instead of just the CEO, the average employee would get $30. This is obviously not going to single-handedly bring them to the middle-class.
Vox uses such a limited definition of “top executive” that only five people are included. What about Wal-Mart’s 1%?
The Wal-Mart 1% will include 20,000 people. To reach the 1% in the US, you need to make $400,000 per year; I would expect Wal-Mart’s 1% to be lower, since Wal-Mart is famously a bad place to work that doesn’t pay people much. Let’s say $200,000. That means the Wal-Mart 1% makes a total of $4 billion. If their salary were distributed to all 2 million employees, those employees would make an extra $2,000 per year; maybe a 10% pay raise. And of course even in a perfectly functional economy, we couldn’t pay Wal-Mart management literally $0, so the real number would be less than this.
Maybe the problem is that Wal-Mart is just an unusually employee-heavy company. What about Apple? Their CEO makes $12 million per year. If that were distributed to their 132,000 employees, they would each make an extra $90.
How many total high-paid executives does Apple have? It looks like Apple hires up to 130 MBAs from top business schools per year; if we imagine they last 10 years each, they might have 1000 such people, making them a “top 1%”. If these people get paid $500,000 each, they could earn 500 million total. That’s enough to redistribute $4,000 to all Apple employees, which still isn’t satisfying given the extent of the problem.
Some commenters bring up the possibility that I’m missing stocks and stock options, which make up most of the compensation of top executives. I’m not sure whether this gets classified as income (in which case it could help explain income inequality) or as capital (in which case it would get filed under labor-vs-capital inequality). I’m also not sure whether Apple giving Tim Cook lots of stocks takes money out of the salary budget that could have gone to workers instead. For now let’s just accept that the difference between mean and median income shows that something has to be happening to drive up the top 1% or so of salaries.
What policies are most likely to have caused this concentration of salaries at the top?
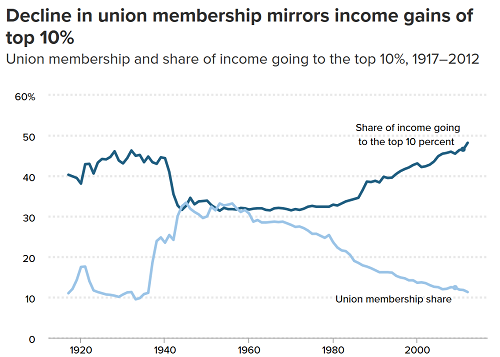
Many people point to a decline in unions. This decline does not really line up with the relevant time period – it started in the early 1960s, when productivity and wages were still closely coupled. But it could be a possible contributor. Economics Policy Institute cites some work saying it may explain up to 10% of decoupling even for non-union members, since the deals struck by unions set norms that spread throughout their industries. A group of respected economists including David Card looks into the issue and finds similar results, saying that the decline of unions may explain about 14% or more of increasing wage inequality (remember that wage inequality is only about 40% of decoupling, so this would mean it only explains about 5% of decoupling). The conservative Heritage Foundation has many bad things to say about unions but grudgingly admits they may raise salaries by up to 10% among members (they don’t address non-members). Based on all this, it seems plausible that deunionization may explain about 5-10% of decoupling.
Another relevant policy that could be shaping this issue is the minimum wage. EPI notes that although the minimum wage never goes down in nominal terms, if it doesn’t go up then it’s effectively going down in real terms and relative to productivity. This certainly sounds like the sort of thing that could increase wage inequality.
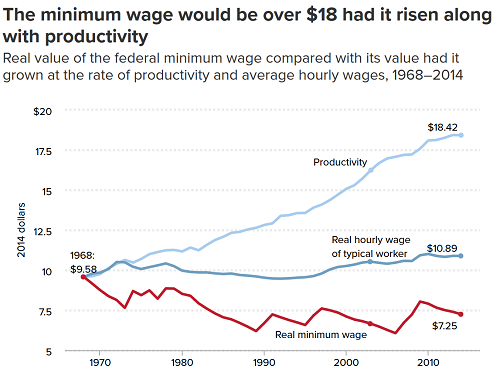
But let’s look at that graph by percentiles again:
Wage stagnation is barely any better for the 90th percentile worker than it is for the people at the bottom. And the 90th percentile worker isn’t making minimum wage. This may be another one that adds a percentage point here and there, but it doesn’t seem too important.
I can’t find anything about it on EPI, but Thomas Piketty thinks that tax changes were an important driver of wage inequality. I’ll quote my previous review of his book:
He thinks that executive salaries have increased because – basically – corporate governance isn’t good enough to prevent executives from giving themselves very high salaries. Why didn’t executives give themselves such high salaries before? Because before the 1980s the US had a top tax rate of 80% to 90%. As theory predicts, people become less interested in making money when the government’s going to take 90% of it, so executives didn’t bother pulling the strings it would take to have stratospheric salaries. Once the top tax rate was decreased, it became worth executives’ time to figure out how to game the system, so they did. This is less common outside the Anglosphere because other countries have different forms of corporate governance and taxation that discourage this kind of thing.
Piketty does some work to show that increasing wage inequality in different countries is correlated with those countries’ corporate governance and taxation policies. I don’t know if anyone has checked how that affects wage decoupling.
9. Conclusions
1. Contrary to the usual story, wages have not stagnated since 1973. Measurement issues, including wages vs. benefits and different inflation measurements, have made things look worse than they are. Depending on how you prefer to think about inflation, median wages have probably risen about 40% – 50% since 1973, about half as much as productivity.
2. This leaves about a 50% real decoupling between median wages and productivity, which is still enough to be serious and scary. The most important factor here is probably increasing wage inequality. Increasing labor-capital inequality is a less important but still significant factor, and it has become more significant since 2000.
3. Increasing wage inequality probably has a lot to do with issues of taxation and corporate governance, and to some degree also with issues surrounding unionization. It probably has less to do with increasing technology and automation.
4. If you were to put a gun to my head and force me to break down the importance of various factors in contributing to wage decoupling, it would look something like (warning: very low confidence!) this:
– Inflation miscalculations: 35%
– Wages vs. total compensation: 10%
– Increasing labor vs. capital inequality: 15%
—- (Because of automation: 7.5%)
—- (Because of policy: 7.5%)
– Increasing wage inequality: 40%
—- (Because of deunionization: 10%)
—- (Because of policies permitting high executive salaries: 20%)
—- (Because of globalization and automation: 10%)
This surprises me, because the dramatic shift in 1973 made me expect to see a single cause (and multifactorial trends should be rare in general, maybe, I think). It looks like there are two reasons why 1973 seems more important than it is.
First, most graphs trying to present this data begin around 1950. If they had begun much earlier than 1950, they would have showed several historical decouplings and recouplings that make a decoupling in any one year seem less interesting.
Second, 1973 was the year of the 1973 Oil Crisis, the fall of Bretton Woods, and the end of the gold standard, causing a general discombobulation to the economy that lasted a couple of years. By the time the economy recombobulated itself again, a lot of trends had the chance to get going or switch direction. For example, here’s inflation:
5. Inflation issues and wage inequality were probably most important in the first half of the period being studied. Labor-vs-capital inequality was probably most important in the second half.
6. Continuing issues that confuse me:
– How much should we care about the difference between inflation indices? If we agree that using CPI to calculate this is dumb, should we cut our mental picture of the size of the problem in half?
– Why is there such a difference between the Heritage Foundation’s estimate of how much of the gap inconsistent deflators explain (67%) and the EPI’s (34%)? Who is right?
– Does the Summers & Stansbury paper argue against policy-based wage inequality as a cause of median wage stagnation, at least until 2000?
– Are there enough high-paid executives at companies that, if their money were redistributed to all employees, their compensation would have increased significantly more in step with productivity? If so, where are they hiding? If not, what does “increasing wage inequality explains X% of decoupling” mean?
– What caused past episodes of wage decoupling in the US? What ended them?
– How do we square the apparent multifactorial nature of wage decoupling with its sudden beginning in 1973 and with the general argument against multifactorial trends?


Hi Scott
this is Anna Stansbury, one of the authors of the Stansbury-Summers paper you discuss in the article. Glad to see you diving into this debate.
I think it would be helpful for your readers to clarify a few things:
In the debates about decoupling, there are really three different debates happening, and often at cross purposes.
(1) WHICH WORKERS ARE WE INTERESTED IN?
The first debate is: WHOSE pay should we be comparing with productivity? This is ultimately a normative question. It doesn’t depend on theory, and there isn’t a right/wrong answer. Rather, the right choice of workers to look at depends on the question being asked.
Some authors look at the average pay of ALL workers in the economy. They are asking: “on average, has workers’ pay grown less than productivity?” This question is the *exact* analog of asking: “has the share of income going to workers (the labor share) declined”? Mechanically, if the labor share declines, average pay grows more slowly than productivity.
Some authors want to look at workers who are more representative of the typical worker, using either median pay or the pay of production and non-supervisory employees. They are asking: “has the pay of typical workers grown less than average productivity?”. This is a fundamentally different question.
Note that mechanically, rising labor income inequality means that the pay of typical workers has grown by less than the average pay of all workers … so even if average pay has kept up with productivity, if labor income inequality has risen, typical pay won’t have kept up with productivity. Therefore as you note in a late section of your piece, and as the EPI has clearly explained, the divergence between productivity and the pay of typical workers is a result – mechanically – of two phenomena: a falling labor income share, and rising labor income inequality.
Throughout your piece, you cite work interchangeably that actually is asking different questions – some of them are asking about typical workers (median or production/nonsupervisory), and some of them are asking about average pay. Feldstein, Lawrence, Winship and Sherk, for example, look at average pay. The EPI focuses on typical workers, who they define as production/nonsupervisory workers, or as the median worker. This is a large part of why they achieve “different results” – they’re simply asking different questions.
(2) MEASUREMENT CHOICES
The second debate happening to do with decoupling is: given our choice on whose pay to compare with productivity, what are the correct measurement choices? This is where choices about depreciation, inflation, health benefits etc come in. In this case there are some right/wrong answers. For example, it seems clearly right to compare *total compensation* including health benefits, and not just wages. All authors in the debate in recent years use total compensation, not just wages. It also seems correct to use productivity growth net of depreciation, since “you can’t eat depreciation” as Dean Baker said. Once again all authors in the debate in recent years use net productivity, not gross productivity. In other cases it’s more complex – the correct choice of inflation measure isn’t necessarily obvious between CPI, PCE and a producer price deflator, and it partly depends on what question you’re asking and whether you think the divergence between the different inflation measures reflects real phenomena as experienced by people, or is simply a statistical artefact.
These measurement choices definitely, as you note in your post, make a difference to the conclusions. Particularly, with sensible measurement adjustments, it looks like *average* compensation has not diverged much at all from productivity and if it has, it has only done so since the early 2000s (as noted, this is exactly analogous to saying that the labor share has not fallen much and if it has, it has only fallen since the early 2000s).
However, regardless of the measurement adjustments you choose to make, it is incontrovertibly true that the pay of *typical* workers has diverged substantially from productivity since about 1973 (as noted, this is the result of labor income inequality having risen substantially since about 1973).
This is the point Larry Summers and I make in our paper, which you quote with confusion: “If I intepret this correctly, it looks like it’s saying that the real decoupling happened in 2000, not in 1973…Nevertheless, Summers and Stansbury go on to give basically exactly the same “Why have wages been basically stagnant since 1973? Why are they decoupled from productivity?”. In the first part of your quote, we are talking about *average* compensation having diverged from productivity since 2000. In the second part of your quote, we are talking about and *typical* compensation having diverged from productivity since 1973 (measured either as median compensation or average production/nonsupervisory compensation).
Figure 2 on page 9 of our paper provides a clear breakdown of the productivity-compensation divergence under different measurement assumptions and when looking at different workers (average versus median). Hopefully this clears up the confusion.
https://piie.com/system/files/documents/wp18-5.pdf
(3) DIVERGENCE IN LEVELS VERSUS DELINKAGE IN GROWTH RATES
Larry Summers and I ask in our paper “If productivity growth increases, to what extent does it increase the pay of typical workers?” Note that we are *not* asking the question: “has pay really diverged from productivity”? It is very clear that in levels, the pay of median workers and the pay of production/nonsupervisory workers has diverged substantially from productivity. No-one disputes this (though they dispute the magnitude). As far as I know, our paper is the only paper on this topic addressing this question, rather than questions (1) or (2) above.
Why is our question a different question from whether the levels have diverged? There could be different reasons why productivity and pay diverged. On one extreme is what we call delinkage: something may be blocking the transmission mechanism so that higher productivity growth doesn’t translate systematically into higher pay growth. But just as two time series growing together doesn’t mean that one causes the other, two series diverging may not mean that the causal link between the two has broken down. Other factors may have come into play which appear to have severed the connection between productivity growth and pay growth. So on the other extreme is what we call linkage: higher productivity growth still translates into higher pay growth, but at the same time, other factors are pulling down pay even as productivity seeks to raise it.
A good analogy: think of typical workers’ pay as the level of water in a bucket. A tap is supposed to fill the bucket (tap = productivity growth). Over the last forty years, the tap has been running but the level of water has barely risen. You are trying to figure out why. Perhaps there is a blockage in the tap, so despite the tap being on, very little water has come out of it into the bucket. Or perhaps the water from the tap has been flowing into the bucket but at the same time there’s a hole in the bucket and water has been leaking out. If the first view is correct, the most urgent issue is to unblock the tap. There’s no point trying to turn up the water pressure because the water won’t be able to flow past the blockage. But if the second view is correct, then if you turn up the water pressure the level of water in the bucket will rise even if the hole doesn’t get fixed — though it’s clearly best ALSO to fix the hole. So we are trying to answer the question: is the tap blocked?
We find that despite the divergence in levels between productivity and typical workers’ pay, a higher productivity growth rate likely still increases typical workers’ pay growth. A one percentage point higher productivity growth rate is associated with 0.7-1 percentage point higher median pay growth for example. This implies that:
(1) higher productivity growth in the future can be expected to substantially benefit typical workers, and so policy to raise productivity growth can help typical workers
(2) if productivity growth had been even lower over the last decades, typical workers would have done even worse – in fact, their pay might even have fallen in real terms
(3) other factors *orthogonal* to productivity growth must have been pulling down typical workers’ pay even as productivity growth was acting to raise their pay. We don’t discuss these other factors much in the piece because we don’t have evidence on them, but you can think of candidates as being the other factors people invoke when arguing about inequality – things like declines of unions and labor bargaining power, rise of globalization, etc.
Note that are findings are *not* contrary to the arguments about decoupling made by others, including the EPI authors. We are not arguing “that wages and productivity are not decoupled” in the sense in which you are discussing decoupling this blog. It is perfectly possible for productivity and wages to have diverged in levels but for their growth rates still to be linked. In fact, we avoid the term “decoupling” throughout our paper precisely because we find it to be a term that often increases confusion since different researchers use it to mean lots of different things!
I’d be pleased to write a guest post/reply in this vein on your blog. I’m really glad you’ve dug into this issue, and it’s great to expose more readers to it; it would be great to clear up some of the confusion and issues raised.
Best
Anna
The reality is that the whole thing is pretty obviously a result of poor inflationary calculations.
When we consider people’s actual standard of living, this is pretty obvious.
The median new house today is about 900 square feet larger (which is more than 50% larger) than houses were about 50 years ago, at the start of the 1970s.
Houses today are of much higher quality – we have AC (most homes back then did not) and central heating. The building materials are of superior quality – we have better insulation, better windows, better carpet, and better flooring.
We don’t use toxic materials like lead paint and asbsetos anymore.
The stuff we have inside our homes is also of much higher quality and value. Furniture has gotten better over time, but the real thing that has gotten better is our technological appliances – we have microwaves now. We have better refrigerators and freezers. Basically everything in the kitchen that runs on electricity has gotten better over time. Stoves are better, as are ovens. Dishwashers, clothes washers, and driers have all improved and become more prevalent. TVs are vastly better, are larger, and homes have twice as many of them on average.
Cars are vastly better as well, and get both better mileage and have greatly superior creature comforts, without dumping lead into the atmosphere to do it.
And we have many, many things that we simply did not have previously – personal computers, cell phones, smart phones, the Internet, VHS/DVD/Blu-Ray players.
The quality of health care has also grown considerably, as has the quality of mental health care. And food quality is also good, and we’re eating more of it, which is resulting in Americans becoming quite fat.
Moreover, we’ve greatly cut down on pollution – air quality and water quality have gone up while things like acid rain are much less of an issue. These are extrinsic costs borne by us – we pay more money for, say, electricity from coal now because we made them spend a lot of money to not pollute as much, and all our cars have catalytic converters in them to make them much cleaner in the ways that poison humans but less fuel efficient.
To put it bluntly – people are much richer than they were previously. The fact that new houses are more than 50% larger and have much better stuff inside of them would suggest to me that wages have roughly doubled over the last 50ish years.
But even that may be understating it.
Imagine a new 1970 house, with everything in it, versus a new 2020 house, with everything in it. Imagine that the 1970 house was, magically, a brand new 1970 house, not an aged one, but it was straight out of 1970 all the way through.
How much more would the 2020 house be worth relative to the 1970 house?
I think it would be well more than double.
People are far better off today than they were back then.
There’s three other issues:
1) Devaluation. I think you overlooked this in the Heritage Foundation article, but it is actually a hugely important thing that is easy to overlook. Devaluation has gone up considerably because of computers. My parents have a 40 year old cusinart. A 40 year old computer is basically a holy relic at this point, and almost completely useless for almost all tasks and programs. Computers are everywhere and from the 1990s to the 2010s we’ve had to replace them probably every 3-5 years or so.
The thing about capital goods is that you basically pay for them once and they make you money for a good long while, but with computers, you pay for them on a regular basis, over and over again, because you have to replace them to keep up. It is only in the last few years that this has slowed so that a six year old computer is only somewhat obsolete instead of a nice heavy paperweight; using a 1994 computer in 2000 was a nightmare, but using a 2013 computer in 2019 is very doable.
But this would explain the “later” wage decoupling – productivity “went up” but a lot of that went into replacing capital goods on a more regular basis. As the saying goes, you can’t eat depreciation. If your company has to spend $2000 more a year now buying electronic equipment for you to use, that means that you’d have to make $2000 more a year in value just to break even wage-wise. This would be a very significant dampener on wages, and in many companies, the cost has probably actually gone up by more than $2000/year.
2) Misattribution of productivity increases from the Third World. Basically: we import more stuff from China and Mexico and often assemble it into more expensive stuff here. People there work for a lot less than they do here. Productivity is basically a measure of value added. If you aren’t careful in how you calculate your productivity (and there’s a number of people who suggest that we’re not), this would look like increased productivity but it wouldn’t actually be increased productivity *here* but *there*, as a good chunk of the growth would actually be “China and Mexico are better at making stuff than they used to be, resulting in more efficient production.” Or, of course, it just being cheaper to employ people there. Obviously, we would not capture this as gains, but China/Mexico might. Both countries are obviously much richer than they were in 1970.
3) Uneven distribution of productivity increases. People who cut your hair haven’t gotten much more efficient at it. People who sequence DNA have gotten *wildly* more efficient at it. If one industry is ten thousand times more efficient and another industry is not at all more efficient, that averages out to an enormous “productivity increase”, but in real life, most industries saw very little improvement. There’s actually a lot of evidence for this; high tech has seen most of the high productivity gains in recent years.
—
But I think all of this is missing the forest for the trees: the entire premise is wrong.
Inflation and productivity increases are actually arbitrary bullshit.
The cost per teraflop in 2017 dollars in 1961 was $156.8 trillion.
The cost per teraflop in 2017 dollars in 2017 was $30.
That’s a productivity increase of 5.2 trillion times.
So the answer, clearly, is that every one of us is actually a multitrillionaire by the standards of the 1960s many times over.
Pretty much everything else that humans have been doing (except improvements in DNA sequencing, which was a direct result of this anyway) completely pales in comparison to this, so it overwhelms… oh, every other factor combined.
The problem is that this is a completely insane answer so we simply pretend that it isn’t the case. But why not? We talk about how much more bread costs today, or a gallon of milk or gas, why not a teraflop?
But this puts into stark relief the fact that we are fundamentally arbitrarily deciding that some things “count” and others don’t.
When we figured out how to make aluminum cheaply, it went from a metal roughly as valuable as silver to something we make cans out of.
That sort of thing just *happens* sometimes, and all of our calculations pretty much have to pretend like it isn’t really a thing because otherwise these advancements outweigh everything else.
But they are clearly quite massive improvements in productivity, so this is basically just a way of saying “Things aren’t really getting better that fast!”
And while that’s a valid argument with aluminum, which mostly just replaced other metals we were using, computers basically let us put the sum knowledge of humanity into our pocket.
Maybe our smart phones really are worth the equivalent of hundreds of trillions of dollars and we just pretend like they’re not because it’s just insane to think about it that way.
But really, I think that the whole thing is pretty much bunk. Acting like these numbers actually have any meaning is probably just flat-out wrong as the numbers themselves are probably without any real meaning due to all the ad hoc adjustments we have to make to make them not result in things like smart phones with the same value as the entire planet in 1961.
@thetitaniumdragon
Where?
Maybe worldwide but my own eyes tell a very different story.
The Berkeley, California house my parents bought in 1972, while working intermittently as haulers and roofers (mostly my Dad but sometimes my Mom would pitch in), when my Dad was in his early 30’s and my Mom in her mid 20″s. When me and my wife bought a house it was in 2011 after a financial collapse caused a short dip in skyrocketing housing prices when we in our mid to late 40’s, and none of my peers growing up here stayed in town and bought a house, with almost all of them having a lower standard of living than their parents and often grandparents had at the same age.
Those I know who have better living standards than their parents?
Immigrants – all of them, not those born here.
The house me and my wife bought was and the buildings I repair are still filled with lead and asbestos, I have to regularly replace the filters for my respirator and make sure that I change clothes before coming home so I don’t spread lead to my son’s – it’s a very rare week that I don’t encounter lead and asbestos.
And the new homes?
I see a few old houses being mostly torn down (but not completely in order to retain the old property tax rate) and rebuilt bigger, but I see far more being subdivided, and what new housing there is is overwhelmingly small cramped condos and apartments – filled with people leaving the suburbs or from across the border and overseas in search of jobs. More than a decade ago there were new single family homes built far in-land, until gasoline prices spiked in 2007, and people couldn’t afford to drive to work anymore from those far locations with in places with Hellish summer weather, freezing winter weather and few jobs.
Lots of big houses standing empty with places that people actually live in being more cramped isn’t a rise in living standards!
Pull the other one it has bells on it!
Oven and stoves with pilot lights from the ’50’s are sold for a premium because they don’t break down anywhere near as often as these damn electric igniter ones!
Yes copper pipes last longer than steel ones, but nothing lasts as long as the “red brass” pipes and fittings from the ’50’s!
The old 1920’s steam heating systems were much more comfortable than the new forced air crap!
I work very hard to jury-rig the old 1960’s brass and bronze plumbing fixture valves (despite replacement parts becoming scarcer or impossible for me to find) because they can go longer without repair or replacement than the new plastic crap!
And clothes?
My wife searches Goodwill and the Salvation Army for old clothes ’cause the new stuff has shallow pockets and is far thinner and less durable, the boots I wear are mostly decades old that I pay to repair because the good durable U.S. made ones may only be mail ordered for a much higher premium than used to be the case, while the stores are filled with shoddy overseas made replacements that cobblers say can’t be repaired when they soon wear out!
Show me one that isn’t a tiny condo!
Who the Hell knows? Land prices are so high relative to wages now and whatever is standing on it is a tiny fraction of the price!
The house me and my wife got waa smaller and older than my parents house, though I suppose it could be argued that the refrigerator is fancier, and some of the pipes were copper instead of steel, but the water heater and furnace really were even older versions of their 1970’s equivalents so I don’t buy any stories about stuff being “updated”, it simply took decades more labor hours to get a smaller older version of what my parents had in ’72.
A bigger chunk of my wages goes to pay for health insurance than in years past and if my son’s are privileged to get to go to college like their mother did it will cost much more, especially more than the free college education my mother had in the late 1960’s and early ’70’s.
And as far as I can tell those younger than me have to pay an even higher percentage of their earnings towards rent than I did at their age in the ’80’s and ’90’s.
This sure feels like declining living standards to me!
Oh by the way, my wife’s 2004 Toyota Prius seems pretty nice, the breaks work really good, but the 1976 Toyota Corolla I drove until 2001, and the 1984 Toyota Camry I drove till 2005 both got better gas mileage.
The smartphone are neat though, I’ll grant you that.
Thanks for the great post.
I’ve only very quickly skimmed the comments.
It’s important to look at total cost of labor, not just ‘compensation.’ I’m not sure if ‘total cost of labor’ is the same as the formal metric of ‘labor costs.’ Increasing payroll taxes in the US would explain some of the decoupling as the incidence of payroll taxes falls almost completely on employee salaries.
see; https://upload.wikimedia.org/wikipedia/commons/thumb/7/7b/Payroll_tax_history.jpg/800px-Payroll_tax_history.jpg
The entrance of China into the global market is never discussed, and it’s rather the elephant in the room. Its labor costs seem to have plummeted since 2012. I’m not sure what happened before then.
https://tradingeconomics.com/china/labour-costs
“Why is there such a difference between the Heritage Foundation’s estimate of how much of the gap inconsistent deflators explain (67%) and the EPI’s (34%)? Who is right?”
Heritage’s graph includes managerial income, I believe.
1973 increase of labor supply (women, expats)
2001 China accession to WTO plus acceleration of expat uptake
I think the argument being made in the OECD paper that confused you was that “skilled workers/’winners’ getting a bigger slice of the pie” *wasn’t*, in fact, sufficient to explain the data; rather, *even among skilled workers*, whoever did the job “best” — the “winner” — got most of the wages. Thus the 0.1% effect: it’s not enough to be a skilled programmer or whatever, you have to happen to be the *best* programmer. Winner-takes-most.
Nice work and comprehensive research. Thank you. My modest, simple thinking: if productivity is measured by production (stuff, things, or revenue) per worker, why would it have a direct relationship with wages (pay per person). Nothing is handmade. Coupling makes no sense, since the start. People think pay is proportional to value, and I hear people saying teachers should be better paid because of their contribution/value to society. This sense of value and pay is not real. Wages, or salaries, are a consequence of demand and offer. If we had fewer people available to work as teachers, the pay would be higher. Why are doctors so well paid? Because the offer is short. Since 70’s we introduced computers, in the 80’s downsizing, in the 90’s ERP, in 2000 the cloud. More technology has reduced the need for workers and wages go down (unemployment going up is global, the offer is up).
That’s all good up until the conclusion, which sounds very confused to me. You quoted a lot of people debunking the claim, but you never stepped back to ask what the claim even means. It’s a complicated claim, so there are different ways to debunk it. Some of them are almost opposite. In particular, some ways of debunking it are just as “scary” as the original claim.
What scares you? Inequality? Then debunking the claim by saying that rising inequality is really due to healthcare (compensation) and housing (CPI/PPI) is not debunking that claim at all.
Rising wage inequality is an effect, not a cause. What would it mean for it to cause decoupling?
If the CEO sucks all the money out of the company, and the company sucks it out of the employee, then company has a bad bargaining position with respect to the CEO, but it is still true that the employee has a bad bargaining position with respect to the company, that it is keeping more of his producitivity. Indeed, the cliche is that the CEO is paid the big bucks to reorganize and extract more from the workers.
I know nothing about economics, but maybe the effect is really not as multifactor as it seems. Apart from some measurement issues, it all might be a result of the decline of the relative economic strength of skilled factory workers (basically, because of automation) that simply caused the “decoupling” through various channels (decline of unionization, easier globalization, smaller taxation of high incomes, acceptability of ultra rich, etc.)
You cannot ignore the coincidence with the closing of the gold window. Breton Woods obviously constrained monetary policy, or the US would not have abandoned it. While there is no obvious direct link between a gold standard and the coupling between productivity and wages, there is absolutely a link between a gold standard and monetary policy, in particular the interest rate the central bank is able to maintain.
One could argue that, since Nixon’s closing of the gold window, and outside a few short periods, in particular the Volcker Shock, interest rates in the US have been held below some “natural rate” of interest. Perhaps just the pressure of draining gold reserves caused the Fed to keep interest rates higher than they might have, which would have maintained the cost of capital relative to labor (since interest rates directly add to the cost of capital). Once that pressure was gone, the Fed had one fewer things to worry about, so they started using monetary policy more aggressively to try to “fine tune” the economy. At that point, central banks around the world began competitively devaluing their currencies, at least intermittently.
It wouldn’t be enough just to reduce the cost of capital relative to labor, because otherwise a “fair” proportion of those gains should have gone right back to labor. Which means the change in ratio would have had to cause capital to become more powerful relative to labor as well. Which is exactly what we’ve seen with the decline of labor unions. And because a lower interest rate also means a lower risk-free rate of return, money that might have gone to dividends and salaries has instead been reinvested in more capital. So we’ve had capital continually growing as a fraction of the economy.
The bright side of all this is that a consistent return of interest rates to whatever that “natural rate” of interest is should over time cause a “re-coupling” of productivity with wages. Of course, it will also trigger a long recession. But I think we’d come out the other end much stronger. This will never be politically tenable, so I think instead things will just continue to get worse and worse until our economic system gets overthrown by another broken economic system, because people will have learned all the wrong lessons from our mistakes.
BW would have eventually constrained monetary policy, but that does not imply that it was already constraining policy. That the US could abandon it fairly easily (for a multinational agreement) implies that it did not constrain policy particularly much.
Perhaps, but this article is about figuring out how much effect various theorized causes could have had on decoupling, not about coming up with ways those causes might not have had an effect.
That being said, it seems unlikely to me that the US would have pulled out of BW just because it would eventually constrain monetary policy. It also seems unlikely that observing the drain on gold reserves that was already happening wasn’t constraining monetary policy. The ensuing inflation is also evidence of easing of monetary policy after the US pulled out of BW.
If gold reserves continued to drain then eventually they hit zero, at which point the US would have to
1. Cancel BW and refuse to redeem dollars for gold or
2. Contract the money supply enough that they could buy gold on the open market at the convertibility rate or less.
Basically the constraints on the MS made sure that the US would bail on BW.
A theory needs supporting evidence more than “hey this happend around the same time you have to consider it!”.
A large chunk of this is just Simpson’s paradox.
These headlines go together:
* Good news! Unemployment is down! Employment is up!
* In simultaneous but unrelated news, productivity is down! Average wages are down! Wage inequality is up! Hurting the working classes!
And these headlines go together:
* Good news! Average wages are up! Productivity is up! Wage inequality is down!
* In simultaneous but unrelated news, employment is down, unemployment is up, disability claims are up, number of people no longer actively seeking work is up.
Productivity and wages are measured per *unit of work*, e.g. per employed worker, per hour or day worked. What’s happening here (or at least a good chunk of it) is that the composition of the workforce is changing as people move in and out of employment.
If the least productive (and lowest paid) workers lose their jobs, average productivity will go up, and average wages will rise, and wage inequality will fall. This happens without anybody getting paid more and without anybody getting better at their job.
If the least productive workers find jobs (after being unemployed), average productivity will go down, and average wages will go down, and wage inequality will rise. This happens without anybody getting worse at their jobs, and nobody is paid less because of this.
To the extent that the periods of decoupling correspond to low or falling unemployment, and the periods of coupling correspond to high or rising unemployment, it’s Simpson’s paradox.
Other things could be happening too, but if you don’t control for unemployment and workforce composition you won’t know.
Edit: Just noticed that this is also @dumky2’s point though he doesn’t use the name “Simpson” or mention unemployment.
Edit 2: In case it’s not really, really obvious, if you care about people’s welfare, unemployment is definitely something you should are about a lot more than whether median wage tracks GDP.
This may be true, but with this effect inequality decreases and the average wage increases when (average) productivity increases. During the apparent decoupling phenomenon the post is about, producivity increased but the median wage didn’t significantly increase, and wage inequality increased.
You might guess that these are true but Scott is pointing to a break in the 1970s and the 70s were a period of high unemployment, not low unemployment.
But I don’t see how Simpson’s paradox could explain the decoupling between productivity and wages. As you note, both productivity and wages are measured per unit of work. That means that low productivity and low paid labor entering or exiting the workforce should push both productivity and wages to the same direction (i.e. entering lowers both and exiting raises both).
Caveat lector: I am not an economist, and I read Scott’s very helpful roundup quickly yesterday, so if he addressed this (it looks like maybe tangentially in Section 7?) and I missed it, sorry. So take this theorizing for what it’s worth.
It seems to me that these datasets actually line up quite well, theoretically speaking, with Scott’s former (also good) article on Cost Disease. What we are looking at is increased production of goods and services, but with less of the productivity boost being captured by the median wage earner. Wouldn’t one valid explanation be that most productivity is actually coming from a relatively small set of people and industries, while more and more workers are in jobs where they are not contributing a lot to productivity? All else being equal, that would result in the median worker being responsible for (and thus compensated for) a smaller percentage of the resulting production, while the smaller subset is more valuable and compensated more highly because their skills are actually useful in production and thus get bid up.
The reason I think this would line up well with Cost Disease is that industries subject to Cost Disease show a pattern of rising costs decoupled from increased productivity. That pattern also, it seems to me, could be explained by low-productivity workers proliferating. If you add lots of low-productivity workers, you will see costs increase substantially, but unless the low-productivity workers have exactly the same distribution of wages as the high-productivity workers (which you wouldn’t expect based on demand), the addition of the lower-productivity folks will stagnate the median wage by sheer numbers.
Economy-wide, this could look both like low-productivity people joining every industry (for example, more lawyers in an engineering firm don’t build more bridges faster, though they may be necessary to function) and also like certain industries showing little productivity gain but growing purely through addition of personnel, while other industries with high per-person productivity produce most productivity growth but with too few people to offset the median (for example, lots more warm bodies in classrooms producing the same basic education, but a lot of productivity coming from a relative few people in tech).
I think you may be underestimating the effects of women’s workforce participation. The increased labor supply had some obvious effects and probably caused much of the initial decoupling. We’re talking about a huge change in labor supply.
As more women got jobs, the labor supply grew. This lowered the equilibrium price of labor. There weren’t immediate pay cuts, because wages are really sticky. Companies and workers hate cutting wages in nominal dollars. Instead companies let wages stay constant and inflation cut wages.
Increased labor allowed people to be employed in less productive jobs. These were jobs that were unprofitable at higher labor prices. As wages adjusted to the new price, they became attractive to companies. Marginal jobs were created, driving incomes down.
This also caused capital’s share of income to rise. All production needs some combination of capital and labor. As the work force increased, the amount of capital did not similarly increase. This caused a relative scarcity of capital, driving up the equilibrium price of capital.
You are correct that it does not explain the changes after 2000, but that seems to be when technological factors really took off.
Labor force participation rate for women rose from ~32% in 1947 to ~43% in 1970, it rose another 11 percentage points between 1970 and 1985. Prime age labor force participation rate also climbed 8 points from 1947 through 1970, a rise matched from ’70 through ’82, which makes it a little unlikely that women entering the workforce caused the major shift in the 70s but not from ’47-’70.
There are confounders here, as overall LFPR only climbed a little during that period due to demographic shifts, however total hours worked climbed as much in % terms from ’47 to ’70 as it did from ’70 to ’90, which shoots a major hole in your theory. If people were being employed in less productive jobs, and were lower payed then you would expect more hours worked, not a very similar increase over similar time frames (and don’t get hung up on the 23 year vs 20 year comparison, there is enough bumpiness in the graph that I can choose start and end dates where the pre ’70 period had higher rates of growth or almost identical rates of growth).
Why start postwar? I am much more interested in 1850-1930 trends than 1945-1960, they are more relevant to today.
Postwar is the easiest to get good data on.
But calling it good data is silly because it obviously starts a a strange baseline.
The data is very good, the conclusions are weak due to small sample size issues.
I’m seeing a rate of 33% in 1950 going to 43% in 1970 to 57% in 1990. Male participation (measuring from the top of the seasonal spikes) went from 88% to 82% to 78%. Assuming male and female populations were equal, this means the workforce was 27% female in 1950, 34% in 1970, and 42% in 1990.
I’m looking at hours worked too. There’s a 40% growth in both time frames. Population grew 34% between 1950 and 1970. Work was slightly outpacing population growth (this is partially because of baby boomers growing up, and I’m using raw census data because working age population doesn’t go back that far with the St. Louis fed). Population increased 22% between 1970 and 1990. This means hours per person increased 4% between 1950 and 1970. It increased 15% between 1970 and 1990.
You say that you’d expect to see hours worked rise if there were lower paid, less productive jobs. Adjusted for population, this is exactly what we do see.
Hours per person isn’t a good metric, most of the population growth in the pre ’70 period was a baby boom, those people didn’t start hitting the workforce until ’63 when babies born in ’45 hit 18 and the influx pretty much kept going into the early 60s meaning the tail end of the boomers hitting the workforce were the college grads in the mid 80s. You want to count hours per working age person.
This is true. As I said, I wasn’t finding that data easily. It’s still better than working with raw hours without population.
It would be if you didn’t know the direction of the demographic shifts, but we do (and I have the advantage of having been through several of these discussions before).
here is one adjustment, though it doesn’t go back before ’77 unfortunately.
This doesn’t explain why labor’s share of the GDP stayed more-or-less the same until 2000, and only wage inequality increased significantly.
I agree, and IMO its because people always mistake in their minds the top earners and equity holders. For most of the time it was elite wage earners that were causing the “decoupling” for the median. They live like capital holders, but earn money differently.
I recent essay in the New York Times titled “
How the Upper Middle Class Is Really Doing” reads in part:Is it more similar to the top 1 percent or the working class?
and it has a chart similar to the one’s our host provided but it starts in 1980 instead of 1973, and it shows the income gains of the top 1% as increasing more than productivity, the bottom 90% as less than productivity, and the “90th to 99th percentile” (the top 10% minus the top 1%, presumably what is meant by “upper middle class”) in income as keeping pace with productivity.
What interests me is that mostly incomes rise and fall in tandem with booms and recessions, but there is one part of the chart that shows that in the early 1980’s the bottom 50%’s incomes were falling, while the top half’s incomes were rising, in no other period do I see such a stark difference.
I’m guessing rising “payroll” taxes and lower income taxes?
Also of note: Apparently in New York Times-speak “Rich” is the top 1% in income, “working class” is 90% of Americans (and includes both “the middle class”, and the “poor”), and “the upper middle class” is 9% of Americans.
Good to know the next time I see those terms.
Thanks for posting this, that article hit on a lot of points that I try (probably unsuccessfully) to hit on when talking about this. That drop in the early 80s is definitely interesting.
Not the end-all be-all, but I think those are at least reasonable definitions. Worth noting top 1% starts somewhere a little south of $500,000 per year.
This also helps explain why “most households will be in the top quintile at some point” isn’t as impressive as it sounds, there isn’t a very large gap between the 60th percentile and the 80th, for instance.
The piece cites Piketty’s work, specifically the graph early on. Some have accused that specific output as being the result of cherry picked data. One critic says
and
And another goes
I have not seen an attempt at a refutation from Piketty against either of these claims (I have seen one to some other charges, as there have been many).
There are some more fundamental measurement changes. The decline in average household size, the shift from C to S corporations, the decline of corporate perks. Even putting aside the issues of inflation and compensation vs. wages, these factors make it very difficult to tease out actual historical levels of wages. I’m not sure a valid comparison can really be made.
Nitpick: $400,000 is the threshold, not the average. I couldn’t find a reliable figure for the average income of the top 1%, I’ve seen figures inluding $700,000 and $1,500,000.
Nitpick: I’m not sure the phrase “labor-vs-capital inequality” is meaningful. Wage inequality means that people make different amounts of money per hour or per year; equality would be if they made the same. But at what (average hourly wage)/(yearly return on $1 of investment) ratio could we say that labor and capital are equal?
Another nitpick: $400,000 is a household figure, not a per person figure.
Not an explanation, but perhaps a useful perspective:
http://www.arnoldkling.com/blog/wages-and-productivity/
It’s a small post, but here’s an excerpt:
I feel my explanation might be a bit lame, but…
The thought is that this gap is a lot to do with automation. The key points:
1. Profit from automation goes mostly to top 1%. Which is the whole point of automation.
2. In top 1% and higher management you don’t have to get more education. Still same old MBA from fancy school.
If we take a factory with some management and say 1000 workers. At some point management decides to automate. They fire all 1000 workers and replace them with robots. They hire new 200 workers to maintain and control those robots.
They have to pay those 200 slightly more, as it is more qualified job. So these 200 get paid 500 salaries of previous workers. So, basically we have 500 salaries released as a profit. But then we can say company reduced prices on the product to compete. At the we have say 300-400 salaries as a profit which upper management shares within themselves.
In this small example we get increase in productivity and some extra money produced by it. Most of these money goes to top 1%, because that was the whole point of automation (CEO wanted more profit). Some of it get redistributed among lower management, as they help to run automated company.
Not obvious. Employment in agriculture has declined 95+% in the last 200 years as machines allowed fewer people to do the same work, but for most of that time it didn’t cause the wages/production ratio to decrease, as people moved to other sectors to make more things (or more valuable things) and make money on it. In your example, as many companies automate, it could be that, as a result of competition, prices drop so much that profits don’t increase (and CEOs need to automate just to maintain profits). Actually, it’s wage inequality that increased significantly. not corporate profits.
Prices drop is very arbitrary thing. There is no perfectly competitive markets. Plus, automation allows sometimes to get rid of competition and keep prices relatively high.
Another thing companies start to produce and sell more. Basically, most of the giants live on sieving plankton.
Another thing that I think wasn’t mentioned is that these days compared to say 1973 people get much higher quality of living for the same or even less money. So, basically today you get lots of those “lost money” in form of some comfort. Like, in 1973 you have to pay a lot to make international phone call or send a letter. Now you can contact anyone on the planet for free.
And I do not think that the second graph in the post really shows that “the modern uncoupling seems much bigger than anything that’s happened before”. Eyeballing the log-chart, we can see rapid declines of unskilled worker annual wages from $2000 to around $1300 around 1812, and then from $3000 to $2000 in 1865, while GDP per person was growing in both cases.
Another factor in growing income inequality is the change in hours worked.
https://www.theatlantic.com/ideas/archive/2019/02/religion-workism-making-americans-miserable/583441/
I find the inflation topic fascinating. Being able to compare dollars in one year to another year is crucial to almost all macro economic subjects and it seems there is a pretty good case that we’re not doing a very good job. Fundamentally – it’s a very hard job. How do you compare the price of the latest Motorola Android phone with the cost of a StarTac phone 20 years ago? Or a Honda Accord from 1980 and one from 2018? They’re hardly the same product.
Don Boudreaux (George Mason Econ professor and, yes, a libertarian) did a bunch of comparisons I thought we’re really interesting on this topic. He compared items from the 1975 Sears catalog and the 2006 catalog based not on price but on the hours a worker paid the average hourly wage would have to work to pay for similar items. The results were not remotely similar to what the CPI would suggest.
I’m a lawyer not an economist, but this seems hard to square with stagnant real wages. And frankly seems more in keeping with lived experience.
These are industrial products. Services and houses may look differently. Also, it’s average hourly earnings, not median.
Granted and I would like to see the data for median wages. A number of things do mitigate this. Boudreaux used salary data for the manufacturing sector which does not include tech, finance or business process. It’s also wage data and does not include total compensation. I can’t a one to one comparison on the BLS site. I can find sub sector comparisons of mean and median hourly wages in the manufacturing sector and they’re fairly close – mostly the difference is less than a dollar an hour.
I only quoted one post in a long series of posts Boudreaux did on these. I remember food and clothing comparisons and the disparity was even more stark.
On housing, as mentioned in comments above, I’d be surprised if outside of land values in a few urban cores you’d see inflation dramatically outpacing wages – especially if you compared centrally cooled living space per square foot. Homes are larger, much more efficient, more likely to have AC and much less likely to have lead and asbestos issues than in the 70s. Households are also smaller – so you have to be careful to compare living space per person.
On services, in particular health and education, is where I assume you’d see the greatest inflation. (Interesting that health care is dramatically improved, but not education if you’re thinking about quality issues in measuring inflation). I’d like to see how much of recorded inflation is due to these two sectors in the CPI, because I think we’d all have very different questions about wages if we’re looking at dramatic inflation in those two sectors rather than general wage stagnation.
In 6., you consider the difference between mean and median wages, but until then you are lax about the distinction. On many of your charts you don’t say if they refer to mean or median wages, and on your European charts it isn’t labeled. The male income chart says median, but you write average. I’m pretty sure that producivity figures are mean, but you never say it.
You never say whether wage figures are net, gross, or total labor cost (including payroll tax).
——
Labor’s share of the GDP decreased from ~63% to ~58% since 2000 according to your chart. Whose share increased? Where does the rest of the income go anyway?
Capital? This is what most people seem to assume.
Taxes? Idk what taxes are even included in the chart.
Anything else? Amortization? If a company has $x in sales income and pays some of it to me as salary, and I use it to replace my broken fridge, that’s labor income. If the company pays some of it to me as a dividend, and I use it to replace my broken fridge, that’s capital income. But if the company spends some of it to replace a broken machine of the company itself, that should show up as neither. That’s necessary spending to maintain producivity, even if the shareholders were to get nothing.
Here there are data about various things as a share of the GDP. Unfortunately many of these overlap; I don’t have any clear, non-overlapping breakdown of the GDP as to where the sales income of all the production goes.
Gross and net corporate profits with blah blah blah have been around 7% and 5% respectively, increasing a bit since 2000, but it has no data on total capital income, including interests, rents, and small business profits. The Piketty highlights post has a chart on total capital income among several countries; it’s 25–30%, with housing increasing and non-housing decreasing.
The two halves of the sentence don’t contradict. They just mean that if we are looking at things from the worker’s perspective, we should probably eliminate the measurement artifacts by using CPI to calculate producivity as well, rather than switching to using PPI for calculating wages. That’s assuming that CPI is actually the relevant measure for workers.
Wow, this is a great post!
Wait, doesn’t the middle graph say that going from earnings to total compensation closes almost half of the gap?
Maybe I’m missing something but I feel like inflation shouldn’t need to enter the picture at all here. We ought to be able to do some comparison like
ratio of (1973 per capita GDP in nominal 1973 dollars) to (1973 median total compensation in nominal 1973 dollars)
versus
ratio of (2019 per capita GDP in nominal 2019 dollars) to (2019 median total compensation in nominal 2019 dollars)
[Edit: oh nice, Briefling did this calculation above!]
If we just look at these ratios we don’t need to know anything about inflation. I guess these ratios can’t tell us whether the median absolute standard of living has stagnated or gone up. But they could tell us whether median total compensation has stagnated *relative to GDP*.
[Edit2: I guess the “labor’s share of output” graph is plotting a ratio like this. It shows a 10-15% decline over the period of interest. So that makes me think the three important effects are:
1. Labor vs capital: labor’s share of output has declined 10-15% since 1973. I think this tells us that mean compensation has lagged productivity by only 10-15%, without having to worry about what inflation has been.
2. Pay inequality: median compensation has lagged mean compensation by ~30% since 1973 according to the EPI link. So median compensation has lagged productivity by 40-45%.
3. Inflation: no one can agree on what inflation has been since 1973, which we would need to know to determine how median absolute standard of living had changed, or how absolute productivity has changed.
]
Wait, this seems like a non sequitur. Just because some people can afford to invest more than others (wage inequality), that doesn’t mean that companies will start paying bigger dividends relative to wages (lower labor share of output). Why would those two things be connected?
Do executives really earn enough to be this important?
I think this is a big part: reading the caption of the Heritage graph, they are comparing “average” (I assume mean) compensation to productivity, while looking at the EPI link they are comparing median compensation to productivity. Since average compensation is much higher than median compensation, Heritage has a smaller gap to explain, so the inflation effect explains more of it.
BW effectively ended in 71.
Most of the effect’s should have occurred in 71, simply closing the window in ’71 implied that it could be closed at any time and the agreement could and eventually would be voided by fiat from the US side at any time. It was really a long bank run, there were more dollars than could be redeemed by gold so even leaving it open would have eventually had the same effect. Calling it temporary is like a ponzi scheme manager “temporarily” halting payouts until more investors can be brought in.
One factor in capital-versus-labor productivity that I think is far too prone to being overlooked is the relative mobility of capital. Labor in general can only benefit from growth in the domestic market; capital can take its profit from foreign ones.
Let us assume that ScandanavianWorkerParadise has 3% annual GDP growth, and 100% of that growth is captured in higher wages by labor. Let us also assume that DevelopingAsianCountry has 12% annual GDP growth, and that growth is split evenly between labor and capital.
In that case, all the capitalists living in ScandanavianWorkerParadise will invest their capital in DevelopingAsianCountry, because a 6% return is better than 0%. And thus inequality will increase between the capitalists and workers in ScandanavianWorkerParadise, even though the workers are capturing a full 100% of the benefit of domestic growth. Because even though they live in the same country, the capitalists are participating in an economy growing 12% a year while the workers participate in one that grows only 3% a year.
And there is no policy favoring labor in ScandanavianWorkerParadise that can close that gap, because, again, labor is already getting 100% of domestic growth. At most, ScandanavianWorkerParadise can try taxing it away, in which case the capitalists leave their profits overseas where the government of ScandanavianWorkerParadise can’t get at it.
In the absence of a labor policy decoupling is probably inevitable.
China’s labor policy explicitly preferences labor so real wages have doubled every decade for forty years, and usually outstripped GDP growth as they did again in 2018 (7.8%).
The net result is that Chinese labor now costs employers more than American labor, when adjusted for productivity and benefits.
Indeed, by 2021, 500,000,000 urban Chinese will have more net worth and disposable income than the average American, their mothers and infants will be less likely to die in childbirth, their children will graduate from high school three years ahead of–and outlive–American kids.
That’s a policy outcome, nothing more.
Source? For context, I find that average income in China is currently 21,586 yuan or ~6240 USD at purchasing power parity.
Adjusted for producivity that’s not as surprising as it would otherwise sound, as the reason Chinese wages are still low compared to developed countries is of course mainly their low producivity.
I wonder if the answer could be as simple as not considering foreign *inputs* to US business.
I find it very likely that us gov numbers for corp. productivity per worked hour measures only the (local?) direct employees and perhaps in-house contractors. Workers contracted through foreign firms (esp. foreign manufacturers) probably aren’t reflected in the productivity number. So as firms offshore various processes their income grows in whatever fashion while their direct employee count remains steady or shrinks making it look like the remaining employees are getting more productive.
In this theory, the missing money from increased “productivity” isn’t all going to capitalists (though some surely is) but is in large part going offshore to pay those foreign firms and their workers. It would be convenient if this would show up in a simple trade balance chart, but those foreign firms can reinvest those US dollars in other things, notably real estate which is not going to scale up worker income in any easily-correlated fashion (mostly fixed supply, most real estate isn’t sold by corporations, etc.).
3. Could Apparent Wage Decoupling Be An Artifact Of Changing Demographics?
To what extent does the slowdown in real median household income growth owe to the rise of single-parent households? For obvious reasons, a household with two parents is likelier to be higher income than a household with only one parent. If divorcing or never getting married to the other parent of your child has gotten more common in America over time, then that demographic shift could partly explain the observed effect on real household income.
On a side note, the growing tendency to delay marriage until later in life, to get divorced, or to not get married at all is surely imposing a financial penalty on a growing number of people since they lack another person to split costs (e.g. – rent, utilities, payments on the one car, vacation hotel rooms) with. Married people also get tax breaks. So even if being single doesn’t affect your individual income (and hence, the income of the household you are the head of), you’re still poorer since a greater share of that income must be spent to cover your basic expenses.
I’d love to dive deeper into two factors in particular if I had the time/resources:
– Relatively recent widespread adoption of Shareholder Theory, the idea that businesses should focus only on increasing value to shareholders. This could perhaps place pressure on wages, since labor may be a stakeholder but not necessarily a shareholder.
– A possible increase in the “coziness” of corporate boards. My laymen’s reading leads me to think there is an increasingly small group of people across the boards of many of the largest firms, all generally advocating for things that benefit them and their elite friends to the detriment of everyone else. This strikes me as probably overly simplistic/conspiratorial.
The second factor was being complained about in the 1960s, so I doubt that it has changed greatly.
The first factor has changed greatly. The trigger was when Michael Milken invented the junk bond which could be used to pay for corporate takeovers. Before that, while the shareholders theoretically had absolute control over the corporation’s actions, it was nearly impossible for the shareholders of a large public corporation to replace the management. The result was that management was more inconvenienced by strikes than by shareholder disgruntlement, and so labor came to be considered a “stakeholder”. Once hostile takeovers became possible, corporations came to be run for the benefit of the shareholders. This had led to some ugly strikes, of course, but the first change was the dismantling of a lot of bloated “conglomerate” corporations.
Inventions like the corporate poison pill put a lot of power back into management’s hands.
How do the results in “Capitalists in the 21st Century” affect this analysis?
http://www.ericzwick.com/capitalists/capitalists.pdf
At least one way in which they might affect it, if I understand the paper correctly, is that CEO compensation changes should be downweighted in explanatory importance relative to changes in the environment of closely-held pass-through businesses (which could include cultural, regulatory, tax, competitive, etc aspects of that environment).
The urban housing shortage plays a big role here, in several ways:
1) Labor/capital split. Much of the decline in labor share of domestic income has been due to a shift to rental income.
2) Average vs. Median. Domestic migration has reversed over the past 20 years or so, so that migration, on net, is to places with lower incomes. Highly skilled workers move to the housing-constrained cities for higher incomes, and lower skilled workers move to open areas to lower costs. This creates significant segregation by income. Some of that is mitigated by different costs of living. Scaled with income, housing expenditures have been relatively level for decades, but this is a combination of persistently high rent inflation and declining real housing consumption. For households with high incomes, that means living in smaller units where incomes are high. For other households, it also means a compositional shift toward living in places where costs and incomes are lower.
3) Inflation rates. Shelter inflation explains about half of the difference between consumer and producer inflation. This is not really a monetary phenomenon. It is more of a tax by “stationary bandits” who here happen to be urban real estate owners who earn excess returns on their land because competing housing is blocked from competing and pulling down rents. Consider current CPI inflation. Core CPI is about 2%, but this is composed of about 3.2% shelter inflation and 1.4% non-shelter components. Real wages are adjusted with core or total inflation, but really, the 1.4% of CPI inflation is the only part of it that should be used to adjust productivity. About 3/4% is that tax by stationary bandits. That has nothing to do with productivity. It is a transfer of economic rents to people who have a monopoly on location.
A shortage of urban housing has become the defining characteristic of post-industrial economies. It could plausibly explain more than half of the divergence.
At the risk of shameless self-promotion, I address it a little bit in my book:
https://www.amazon.com/Shut-Out-Shortage-Recession-University/dp/1538122146
> A shortage of urban housing has become the defining characteristic of post-industrial economies.
Thankfully not in Singapore. Or, at least, it’s getting better rather than worse, and they really have only a small amount of real estate and are really committed to building up.
I haven’t gotten around to your book, but if it is anything like your blog posts then I think a lot of SSC readers would like it. Very thorough, detail oriented, logical approach.
Not that I agree with your conclusions, but that is just another recommendation point!
Hopefully I will get around to it soon.
Don’t use cross-sectional data to make longitudinal claims!
This definitely matters if you are talking about class mobility. If you are talking about income inequality it is much less important, except that you probably need to attempt to separate out by age to account for people at different points in their careers.
Yes! The majority of Americans are in the top income quintile for at least part of their lives (if memory serves the number is closer to two thirds!).
Snapshot pictures of one year income stats are extremely deceptive when people tend to go up and down the income escalator over their life stages. They are in the lowest quintile when students, and first starting their job and single. Go up to the mid quintiles with experience and marriage to two income families, and hit the top quintiles at middle age, before dropping to the lowest quintile when retiring (and living off assets, not Income).
Increases in inequality is in great part also a measure of the height of the life stage escalator. The US has a higher escalator than most places, to our benefit, leading to the higher levels of economic dynamism and the highest AIC of any large nation ever.
That isn’t terribly surprising, assuming that is really “the majority of households” that’s just a household income of $100,000 I believe.
When people talk about inequality, they’re usually talking about higher percentiles than just top 20% (because there is not a lot of separation between 80th percentile and 60th the way there is from say, 80th to 90th).
Measuring inflation is hard. You have to bring in a lot of philosophical assumptions that might not match someone else’s.
My understanding of CPI is that they try to actually look at what people spend their money on, to determine what should be in their market basket that they use. So If people over time spend more on computers, then that will be a larger share of the basket and be a larger percentage of the calculation.
If you take all of the new communication and computer technologies out and go back to what people were purchasing in the 70s and 80s, what you are left with are the things that look terrible, inflation-wise: housing, food, healthcare, education, etc.
So if you are the type of person who buys a lot of toys (like me), prices on those toys have come down so much that things don’t look so bad.
If you are too poor or not interested in those toys, the prices of the necessities are through the roof.
Yes.
My understanding is the exact opposite. It is luxuries which have gone up, and food, clothes, energy and such are declining or at worst holding even as a share of median income.
Some facts…
Housing square footage of new homes went up from 1000 in the 50s to 2500 today as family sizes plummeted. Share of income going to home purchase is down from 21% from 1985 to 2000 to around 15% today. My take on housing is we are getting a lot more for less of a share of our income. Obviously not true in some screwed up coastal markets (my home has not appreciated in 20 years in the Midwest even without correcting for inflation).
Health care is going up in price, though I would rather have today’s healthcare at today’s price than twenty years ago at that price. But I agree it takes up a larger share of our income, especially for the lower quintiles.
Education is getting more expensive, but most is paid by taxes. Most Americans are educated through high school. Some go on to a few years of college, and around 25 or 30% go on to get a degree. The highest costs are in elite colleges which are not frequented by the lower income quintiles. These wisely tend to go to community colleges which are still quite affordable, followed by a few years at a state college. Again, those really hurt by education costs are the higher income quintiles with their public schools, high local property taxes and elite universities.
Cars, electronics, appliances and such are taking up less of a share of income.
Inflation has hit much, much harder on luxury goods, status goods, and things purchased by the wealthy. It’s not even close. The one exception is health care, which is often substantially subsidized for the poor and retirees.
I would want to look really hard at the data to see how that decrease happened (off the cuff, I would want to compare who was buying homes then vs. now, among other things). It also ignores housing costs for non-home owners (which have definitely gone up).
I also think there has been “scope creep” in terms of what is required to be a truly functional member of society. Yes, there are many things that are cheaper now than they were before, but more of them are essentially “mandatory” now where they were optional or outright luxury items in the past. In other words, individual “essential” (using a loose definition of essential that would include something like a cell phone but exclude cable television) goods might be cheaper (at least in some cases) but I think that may have been outpaced by an increase in the number of things that have moved into that essential category.
Every one of those goods has been affected by the number of toys. the average house in 1973 didn’t have air conditioning, a microwave, dishwasher, or dryer. Today, almost all of them do. It also had half the square footage per person and was a lot less energy efficient. If you’re buying a 1973 quality house today, the price is a lot more comparable. the improvement in healthcare is even larger. Improvement in education is more complicated, but while I might not want to call it improvement, the number of people employed by schools per pupil has exploded.
Yes, finally somebody else notices this strange coincidence.
On the subject of having two different methods of adjusting for inflation, wouldn’t it be possible to evaluate the annual percentage change of productivity and wages, in nominal dollars, and compare productivity change per year with wage change per year?
Granted, the total isn’t going to be a sum or even product of the nominal changes in each year, but if productivity increases by a larger percentage of nominal dollars every year than wages do, differing measures of inflation explain 0% of that observation.
This is a great piece. I think that you rightly point out that the fundamental question is whether life is getting better for certain groups of people, and so I think the obvious thing to do is to look at quality of life measures over time (deaths of dispair, drug use, how much emergency savings families have, measures of sense of financial stability, sizes of homes, etc), and not to agonize over the right inflation measure (which isn’t going to be resolved except by looking at the more fundamental metrics above).
(If you are looking for even more topics-that-everyone-is-interested-in to write about I would like to see a deep dive on the Amazon NYC subsidy issue [Are subsidies necessary? Do they create value or is it a race to the bottom between cities? Did Amazon actually get special treatment? Is there going to be gaming of the criteria to collect the subsidies?])
People who make percentile graphs which aren’t zero-indexed are going to Science Hell.
Seems like they’d be more likely to end up in Statistics Hell…but then I’m not sure Statistics Hell is any different from just doing statistics.
I know Summers is more famous, but as Stansbury is listed as the first author on the paper, I think she should really be referenced first whenever the paper is cited. And it should certainly never be referred to as “that Larry Summers paper”. Academics are sensitive about these things, and anyway it’s good to give junior authors due credit. Thanks!
Seems like Scott is underestimating the impact of technology on inequality based mostly on a single ambiguous paper, whereas a survey of economists found that 81% agreed (and 5% disagreed) that “one of the leading reasons for rising U.S. income inequality over the past three decades is that technological change has affected workers with some skill sets differently than others.” http://www.igmchicago.org/surveys/inequality-and-skills
Even the authors of the opposing study Scott references are only making this relatively weak counter-claim: “This tends to militate against pure technology-based theories of the productivity-compensation divergence”
I think these are the most valuable posts you do, Scott. I hope you continue them and even go back and supplement old ones as new data comes out. For example I’m curious what you would think of Radley Balko’s list of reasons why criminal justice is racist, vis a vis your race and justice post.
I want to second this. I was happy to see the first “much more than you wanted to know” post of the year when I woke up this morning.
“Many people have pointed out that Apple has 100,000 employees and makes $250 billion/year, compared to WalMart with 2 million employees and $500 billion/year – in other words, Apple makes $2.5 million per employee compared to Wal-Mart’s $250,000. Apple probably pays its employees more than Wal-Mart does, but not ten times more. So more of Apple’s revenue goes to capital compared to Wal-Mart’s.”
Are you … actually comparing gross revenue to wages, not including cost of revenue and thus margins?
WalMart has far lower margins – if we check their finanicals (I used the NASDAQ summary), we find $500B in gross revenue, at a cost of $373B, for a gross proft of $126B, $106B of which went to “sales, general, and admin” costs, with a net profit of a mere $10B.
Apple’s $265B in gross revenue had a cost of $163B, for a gross profit of $101B, and a net profit of $589B … because their “sales, general, and admin” costs [salaries and marketing, roughly] was a mere $16.7B.
Apple has a lot fewer employees, but more higher paid ones, no doubt.
But mostly Apple sells products with nice, fat margins, and many of them at nice, high prices. WalMart sells products it makes very little on per each, mostly, in very large quantities. Margins, margins, margins.
(Really, comparing a giant no-margin retail chain with a high-end tech manufacturer and service provide that also has some boutique retail is … well, they ain’t real similar.)
Apple may or may not have more “capital” than WalMArt – all those stores and trucks are capital, just not very productive capital in terms of percentage returns. Again, razor margins, vs. Apple’s boutique products.
(Also, ref one of the early charts, we see the bottom 10% of wage-earners barely making more, or making less than ’73, compared against aggregate productivity.
Do we have any data on how much productivity increased for the bottom 10% of pay jobs? Aggregate productivity isn’t really how productivity increases work, is it?)
> Do we have any data on how much productivity increased for the bottom 10% of pay jobs?
Huh. Just watched a video of Peterson complaining that nobody in the political spectrum cares that bottom 10% by IQ are basically unemployable (they’re not even allowed in the army under 83).
Could be as productivity increases job complexity increased as well, and quite a lot of people just aren’t able to keep up. Add minimum wage to this, and they’re hanging to their jobs by a thread – of course they won’t be getting any raises.
There is a very important fact that an increasing fraction of people’s worth in the job market is derived from the cognitive capabilities measured by IQ tests. That has a lot of ramifications, though I don’t know if wage stagnation is one of them.
There is one striking example of a real multifactor trend that actually exists, where each factor is (mostly) independent of the others: cancer. In order to get cancer, you have to have mutations in multiple genetic pathways.
– replication signalling (i.e. RTKs)
– inhibition of cell death signalling (apoptosis)
– overcome cell division limitations (via telomerase, or G2 checkpoint nullification)
– angiogenesis
– overcome immune surveillance (tumor-associated leukocytes, chemokine/cytokine signalling)
If you’re a cancer and you do all of that you still haven’t metastasized, but you’re at least big enough for us to identify you on an x-ray. Some factors affect others, for example if you overcome cell division limits by blowing past the G2 checkpoint you’re more likely to create genetic instability through BFB cycles and increase the mutation rate. Other factors have to be correlated, even if they aren’t causally links, for example if you increase cell division by hyperphosphorylation of RB that necessarily leads to activation of p53 and apoptosis – so you can’t drive cell division through RB without first taking care of p53. All this to say that yes, in biology there are multifactorial mechanisms.
If you smoke a pack a day for twenty years and then get lung cancer we say you got it from smoking – because that’s what drove the increased number of mutations that led to you getting cancer. But not all cancer is caused by a single source of exposure to mutagenic compounds. Most cancer is a slow accumulation of mutations, whether driven by mutagens or random normal chemical reactions, and does not otherwise have a single cause.
That doesn’t mean this is the same for something like the earning/productivity gap above, but it is a counter-example to the claim that multifactor trends are not a thing.
It seems to me that mechanization/automation is the leading factor if you are going to define wage stagnation as “stuff made” vs “wages paid”. It is fairly easy to find and example of a factory where production has been consistent for ~60 years while they have reduced the workforce by ~90% via robots/tech.
This would help explain the female graph too, since they tend to gravitate to employment that has not yet been subject to much automation.
The consequences of that are not obvious. Employment in agriculture has declined 95+% in the last 200 years, but for most of that time it didn’t cause the wages/production ratio to decrease, as people moved to other sectors to make more things (or more valuable things) and make money on it.
The wages to production ratio change is very obvious inside of any sector that has been subject to automation.
Overall, the change is subtle, because you are correct that we cannot just assume that those displaced remain unemployed. They tend to get other jobs, earning other wages, contributing to other production. Maybe some remain unemployed, maybe some find an even better job. But we can assume that the vast majority move on to the next “best” (AKA worse) job.
For example, most of the people displaced from “set for life” union jobs at that factory have probably moved on to Wal-Mart type jobs.
Why should wages and productivity be coupled? Seems labor was historically the primary economic bottleneck, and to a large degree nonsubstitutable, so that the observed coupling made sense, but as labor becomes increasingly substitutable why would it same returns as productivity in general?
I think the answer to this is because “wages” are adjusted by the CPI, which includes products getting cheaper, making it more like “purchasing power”. Whether productivity increases lead employers to hand out raises, or cut prices, or invest in R&D, it ought to show up as an improvement in consumers’ lives somehow or other. The extent to which CPI does an adequate job of that is discussed in section 4.
Only true if firms drop prices by the same amount needed to offset the loss of demand for workers. The value should show up somewhere, which Scott tries to find in the analysis of returns to capital vs workers, but it doesn’t have to show up in worker purchasing power.
How much is income inequality is offset by government transfers of wealth? Specifically, this would include things like Medicare, SSI, EITC, WIC, and other welfare programs. Presumably we care about whether the poor are having difficulty getting ahead because they just can’t earn enough, compared to the rich. Many economists adjust for government transfers in addressing this question and find that they have a significant leveling effect. The Right might look at this and say, “Ha! It’s not as bad as you thought, stop worrying about it so much.” while the Left looks at it and says, “See? Redistribution can solve this problem; let’s do more of it.” Meanwhile, if the top 0.1% make huge wage gains while the bottom 20% get lots of government transfers, what’s happening with the middle class?
Many of these graphs are talking about the rate of change. As such we should really be looking at derivatives, not the raw data. I think applying derivatives would make this more understandable, and allow for apples-to-apples comparisons when date ranges don’t match up exactly between graphs.
This is especially important when looking at long-run data, as the visual ‘gap’ between the data lines is highly dependent on initial conditions and short-run trends. Thus, Scott’s periods of decoupling and recoupling actually represent three trends on a graph of the derivative: decoupling in favor of productivity, decoupling in favor of labor, and coupling.
Great article, two thoughts.
I would say that trying to break up income gains by educational attainment level is problematic given that the quality and standards of each credential have fallen since 1970 precisely in order to accommodate greater numbers of people concentrated in those areas. Ceteris paribus a shift from HS -> Bachelors and Bachelors -> masters would see wages in each group stagnate or fall whilst the overall might increase.
I also remember discussions brought on about how tax changes might incentivize certain kinds of compensation packages for the very wealthy that are more/less easy to track at any given point in time.
There is a math error in the following:
1000 times $500,000 is $500 million, not $5 billion. This would bring your $40,000 figure down to a much more modest $4000.
This graph is one measure of Labor’s share of income divided by the labor force participation rate. This gives us a somewhat cleaner picture of what is happening without some of the demographic noise, and we get 3 clearer stages, ’47-’70 with a fairly flat ratio followed by a long decline starting in 1970 and the a flattening again in the late 90s.
Further almost all of these measurements are pre tax/pre transfer, in terms of economic analysis taxes and transfers serve to widen the base gap between the payer and receiver of the tax. Both experience high marginal rates, lower class workers often see 100%+ marginal tax rates when you look at benefits that they would lose if they saw a pay raise which holds down their wages. This effect is well known, but the opposite end of the spectrum is usually ignored. High marginal tax rates for the rich means you have to offer much higher wages to induce people to take on the burdens that are required for 9x% of people to become rich. Years of schooling and debt, longer working hours, high cost of living areas. The top marginal rates in the US when you count federal, state, local, sales, property taxes etc are well over 50%. Giving someone and extra $20,000 in compensation at a certain level that they will actually experience will require an extra $40,000 to $80,000 in actual pay.
I don’t at all find economic inequality in the US surprising, the system of taxes and transfers is set up to push inequality, and I don’t think that it is any coincidence that the divergence started between the late 60s and early 70s shortly after a massive legislative shift towards more transfers. It may or may not be a coincidence that household inequality stopped widening so much shortly after welfare reform in the mid 90s.
This won’t address 100% of the discussion, but without this as a starting point you can’t really discuss median wages or inequality.
You think the progressive tax system and assorted welfare programs are “set up to push” inequality? That’s a bold claim. I could see it being an unintended consequence, but not as a conscious decision. (Or am I misreading you?)
FWIW, I do want to see more of these papers study post-government inequality, not pre-government inequality.
I’m not talking about the intention of the legislators, I’m talking straight line economic implications.
There is also a fair amount of supporting evidence. Average annual hours worked by employed persons drops right after the great society (passed in ’65 but funding was ramped up over the next few years) and falls for a while, but is more than offset by rising labor force participation rate from ’75 on. There is also a sharp decline in people per household which arguable happens at the same time.
These are the exact responses you expect from these types of marginal tax rates. Low income households split into as many fragments as they can and cut hours to keep under the highest implied tax lines while high income households shift ever further toward double high income with few kids.
How is it that this decoupling lines up almost perfectly with Nixon taking the US off the gold standard, and it is never considered? Try this: look at the average and minimum US wages in terms of gold from WW2 to now. It is quite striking.
Because there is no reason to believe causality, the US had been off the gold standard for decades at that point and Nixon’s closing of the gold window only effected foreign government’s ability to redeem, not average citizens.
In a free market, it doesn’t matter who can redeem, as long as someone can redeem.
Its wasn’t a free market though.
It was free enough that Nixon felt compelled to stop it.
Also, if you believe that there is a lack of causality, imagine the experiment being run again, but this time workers were paid in gold instead of USD.
For you to make the ‘no causality’ argument, you would have to assume that everything would come out the same after the removal of the standard in the two experiments, the one where the workers were paid in gold, and the one where they were paid in USD.
I don’t see how you could think the results would have been remotely the same.
The window was open to foreign governments, those aren’t free market participants and much of the redeemed gold stayed in their vaults.
The second part of your post makes no sense, you would have to contend that people being paid in gold prior to 1973 would have lead to the exact same situation.
But foreign governments (and central banks) could and did redeem dollar holdings in gold, and that did place constraints on US monetary policy. In particular, during the Bretton Wood era and excluding the immediate postwar realignments, US inflation rates were effectively capped at 5% – anything above that (or any significant deflation) would have lead to foreign governments and bankers arbitraging dollars vs. gold even if US citizens couldn’t. One Bretton Wood went away, inflation (CPI and PPI) shot above 10% almost immediately.
That doesn’t mean that abandoning Bretton Wood and/or the gold standard caused the wage/productivity decoupling under discussion. But it seems clear that inflationary effects e.g. the CPI/PPI mismatch, are a big part of what we are looking at. If Bretton Wood constrained all inflation to low levels, then it is possible that the underlying cause of “wage stagnation” began some time prior to 1973 but was unable to manifest visibly until that constraint went away.
1. US gold reserves were being drained from the 1950s through convertibility despite stable inflation.
2. BW committed its members to maintaining their exchange rate against each other, severely limiting their ability to arbitrage the situation. To make an exchange for $100 worth of gold they first had to sell $100 worth of goods and services to the US (or any country that already had done so). Such a move is not an arbitrage but a bet on the future direction of the US dollar.
3. The Fed was not constrained by BW, the claims by foreign countries were that the US was exporting its inflation from its preferred position and that they could basically print and buy without inflationary repercussions.
4. Even if you ignored those points you still have no reason to believe that the ending of the gold window is causal since the complaint here is that the value of goods and services produced by the US has continued to increase while the wages of the workers has stagnated. The goods and services are bought with US dollars and would have been subject to the same forces from the ending of BW, you have to argue that ending BW uniquely effected labor prices but not the prices of goods and services sold in US dollars. It takes more than a “hey didn’t his other thing sorta happen at the same time” to make the case for that.
It’s striking in the sense that that the curve is shaped mostly by the ridiculous volatility of gold, and has almost nothing to do with minimum wages. Please measure wages by a broad-based inflation measure of one sort or another, not an arbitrary B-list commodity price.
The use of a broad-based inflation measure is exactly the problem. Knowledge is created, and products get cheaper. Hedonic adjustments in inflation measures allow the currency to be inflated, and the poor and working classes get screwed out of the products of that knowledge creation.
Monetary inflation is a much better ruler to use than price inflation.
Lol, no. Price inflation matters, monetary inflation per se is irrelevant. Cheaper consumer goods have disproportionately helped the poor and working class, who consume a lot more relative to their income, and consume the types of goods that decreased in cost the most.
Cliff,
I didn’t say which matters, I said which is a better ruler. By that I mean a better tool to measure by.
Monetary inflation (e.g. money printing) is only one component of price inflation. If you have monetary inflation but more demand for holding money then prices may not increase.
Most of the libertarians on here want to argue that productivity increases among the 0.1% explain away most of the ‘gap’. A smart Marxist (I’m not one of those) would probably point out that ‘productivity’ is a contested and not a neutral concept. A Marxist would surely argue that those ‘productive innovations’ of the 0.1% include such technologies as derivatives. Those derivatives helped precipitate a crisis which in turn increased wealth gaps by allowing 0.1% ers to buy up very cheap real estate (I’m not quite asserting a conspiracy). More broadly, how much of this ‘productivity’ has just been a set of techniques for spiriting away surplus from the majority to the top? Is there anything in the jargon and data of ‘productivity’ that can really get at the difference between the innovation of derivatives, and say quantum computing technology?
A couple possible counter-arguments:
1) Speculation has real value, because it’s what conveys price signals that allow for efficient usage of resources. *waves in the direction of Hayek*
2) I suspect at least part of it comes from the increased scale of modern society. If I sell a widget to a million people, and make $1 each, I’m a millionaire. If I sell them to a billion people, I’m a billionaire. As globalization has expanded in recent decades, the potential size of a successful firm(or entertainer, or any other highly-scaleable way of making money) has also increased. That means the rewards to success have gone up a lot as well. I doubt doctors make much more than they did 50 years ago, but pro athletes and successful founders are orders of magnitude wealthier, because they can provide their services to orders of magnitude more people.
Also, not a counter-argument so much as a pet peeve: derivatives didn’t cause 2008. Excessive speculation in the housing market by normal middle-class people caused 2008. Derivatives changed which firms went broke, and made the worst parts of the crisis more opaque (and thus harder to solve in the short term, to be fair), but they were never the real reason for it. But blaming normal people is very unpopular among normal people, so we go hunting for scapegoats.
Tight money supply caused 2008. This is quite clear in the data, where every major inflection was a result of Fed policy
No it isnt clear in the data unless you define each inflection point as tight money.
Fed announces an interest rate hike, market plunges. Fed announces QE, market soars. Not obvious enough for you? You can see the natural rate of interest in market interest rate trends. It’s not rocket science. If inflation expectations are plummeting and you don’t cut rates, you’re tightening the money supply.
No its not since that isn’t what happens.
So you have N problems here.
N-1 is that SS doesn’t say that raising interest rates causes the market to plunge, he claims that raising rates more than the market expects does that.
N-2 is that he doesn’t claim its always true
N-3 is that he doesn’t support this with data, he says “in my experience” and “I am sure everyone agrees with me”.
Maybe you misunderstand. That is what DID happen.
Your N-1 and N-2 are not problems for this and I never disagreed with them.
I’m not going to redo the work of going over all the events of 2008/2009 and on since this has already been done. Read some Scott Sumner if you haven’t.
I’ve read SS, and hes wrong, but I am not going to argue with someone whose entire line is “nuh uh, read something” without actually presenting evidence that can be countered.
This sounds backwards. The Fed targets interest rates and buys and sells treasuries to hit those rates. Calling rates communication misses the function of everything, the Fed doesn’t know how many treasuries they will have to move around to hit that target so most of the information, ie communication, is in the actual buying and selling. That is the unknown required to hit the known.
But to this extent the original proposition still doesn’t hold. The fed wants full employment and stable inflation, and only care about interest rates as a way to influence that, the next level down is that they only care about how many Treasuries they buy and sell to influence the interest rate which they only care about in terms of macro outcome X.
So I am not entirely sure what your point is here. The buying and selling of treasuries isn’t (supposed to be) a communication channel, its supposed to be a physical shifting of the markets.
These aren’t the first-order effects according to monetarism (which is what Cliff is arguing for, not sure what your position is), supposedly the Fed announcing its target is enough to make the markets move under the right conditions without ever actually having to partake in OMO.
I’m going to go ahead and place the burden on you here since even the Fed chairman at the time agrees with me
No, its not just. Monetarists like Scott Sumner have argued that the OMO never need happen once the Fed has enough ‘credibility’.
You made a claim, the burden is on you.
I disagree, but I also think this is not the place to hash it out. Casually introducing such a famously contentious but only tangentially relevant topic like this seems kind of flamebait-y. Maybe we could all (re)argue this in the next OT?
I think an economic debate would even be fair game in the current CW-free thread (unless my understanding of CW is incorrect).
This libertarian argues differently. Productivity and wage rate have a chicken and egg relationship. Under socialism the soviet workers quipped “They pretend to pay us and we pretend to work.” People respond to incentives.
As for the 0.1%, there will always be a small slice of people who are productive in nearly any setting. There is also a small number who tend to be disruptive in almost any setting. The job of management in any large organization – business, army, nation – is to convince the vast majority in the middle to follow the example of the first group and not the second group. Traditional western culture did this well, and prosperity followed. Socialism does the opposite, and any good results depend on the output of a very few heroic types.
Does “management quality” matter in these discussions? That is, someone who’s in charge of a billion-dollar company can have a much larger impact in absolute terms of the value of the company. And since there’s ultimately a single C?O, you can’t get better value by hiring more people at a lower rate. As such you end up seeing the same results as professional athletes where you are limited to the number of people you can have operating in any particular position at one time.
This seems related to the so called administrative bloat that has been discussed in relation to college education. Whether at for-profit companies or non-profit universities, executives seem to have progressively diverted to their pockets larger and larger shares of the finances of the institutions they manage.
I protest: “It could also be Canadian!” with a barely perceptible Canadian accent.
I think you’re missing a fairly large housing component to this puzzle. Given large rises in rent, homeowners have essentially taken additional compensation in the form of the returns to homeownership, particularly in the “closed access cities” (SF, NYC, Boston, DC, etc) where supply constraints are rampant. This probably makes a big chunk of the puzzle disappear for homeowners. For renters, it makes the situation consistent with the CPI-based measures you show.
One general note, but I think it possible you might be underestimating the capital vs labor share impact. I would need to dig deeper to say this with high confidence. But ordinary labor income is probably much more reliably reported tracked and taxed than both capital and capital returns.
Hi Scott, I have been reading your blog and quite enjoying it. I would like to think that I can offer to you a good read on the topic of wages, and that your understanding might be enriched. Please forgive me if I am a bit wordy, I am new to explaining this particular phenomenon. I would be grateful if you let me know which parts are clear and which are problematic.
The key to understanding wages is to notice that wages are set through the actions of people who participate in a market that spans not just space, but also time. Most explanations (maybe almost to the point of every explanation,) consider a worker and an employer considering all of their choices at a given point (fixed) in time, and neglect the across time dimension. The standard explanation goes as follows:
A worker has various offers in some location, plus the possibility of relocating to some other location where rumor or actual contract offers some additional choices. The employer has a similar array of choices; He has a local talent pool, or he can offshore or relocate his office or plant. And so we have a market. There is a supply of labor at various price points and a demand for various levels of skill, and at the point where bid meets ask a wage agreement is struck and a wage is set. Of course this wage is local; If a giant dam is being built in one locale, then demand for engineers and truck drivers, blasting specialist etc. will be higher than the historic average and wages will be higher there than in other areas. In some other area wages for these talents will be much lower and workers will relocate to work on the dam and take advantage of the higher wage. When the project is done there will be a surplus of workers with those talents in that area and wages will sink below the historical average. Here the classic theory ends.
For a more complete understanding consider a simpler example. I want to hire a guy to mow my lawn or field this season. I meet a guy with a mower or tractor and we seek to make an exchange. I ask myself what is a fair price to offer the guy, and I remember how much have I paid in the past for mowing, I remember how much my neighbors have reported paying for similar services, gardening or plowing or mowing – also in the past. I might make some allowance for the current price of mower fuel. And ‘the guy’ with the mower is thinking through his side of the calculation. He is remembering how much was he paid for a similar sized job in the past, he has some rumor information of what other mower guys have charged or are asking, and he knows how much fuel cost in the past, how much he paid for his tractor and trailer &c., what it cost him to eat and rent a home &c – in the past. So he has some minimum number where he knows he will come out better off if he takes the job, and some number below which it is not worth it for him to take the job. All this data is from the past. So the two of us come up with an agreed upon wage – based on numbers from the past – and we make a contract. Today. Then a week or more into the future he shows up and does the work, then later I pay him, then later he takes the wages and spends some, and saves some for even later purposes, maybe he needs to save for a better tractor, to buy a house, some big and rare purchase we all face, plus the possibility or inevitability of retirement or illness – all in the future. So here is the key:
All these calculations and agreement take data from past purchases/sales/wages and apply them to projected future costs. So markets exist across time as well as across space.
Now lets look at the measuring tool that we use to compare costs. Traditionally in ‘the west’ we used gold or silver coin, or paper certificates redeemable in gold or silver. Every year we dig up more and more gold, but economic growth has generally surpassed the growth in the supply of gold and silver so prices for goods and services fell slightly year over year on average. So when employers and workers set out to agree on a wage, they could look at a long history of wages for a particular task, say bricklaying or web development, and they could reasonably expect that – absent some unusual event or dislocation – the historic wage would give the worker a certain (based on historic data) quality of life or benefit, or maybe a slightly better one due to slowly falling prices. So there is a good and well established start for negotiations. And then supply and demand and quality of skills offered or needed can modify the price accordingly.
Now ask yourself how this process changes when the value of the measuring tool – i.e.. the value of money – decreases steadily over time? As long as the decrease is small but steady, people will ignore it. Because there are many other uncertainties in the calculation that are of greater concern than 2% or 4% or 10% annualized inflation. Now consider what happens to a workers wage earnings over the cost of a lifetime if every year he looks at last year – past, – agrees on a wage, – present – and then collects the wage and spends the money in the future, and the shrinking value of the money takes 2% or 3% of his wage away? Every calculation gets biased against the worker. Then compound the effect over a lifetime. Now if you understand exponential functions and the compounding of fractional losses then you might have a guess as to why Paris is burning.
Because wage agreements need to be assessed over long periods of time, they need a measuring tool that maintains some consistency in its nature over time. Using ‘fiat currency’ to measure wages is like a carpenter measuring his boards with a slinky spring instead of a steel tape. It does not give consistent results. Except it is worse because the error is always biased against the worker. And as the years and decades pass a generational knowledge of what proper wages should be for various tasks is completely lost. The proper value of assets gets screwed up by inflation as well, but that is a different essay. After decades of inflation no one knows anything about wages anymore. The tool people need to make informed decisions isn’t available anymore.
In an economy that uses real money, that is gold, even the most unsophisticated participants can reason out “Well, my father was a bricklayer, and he got paid X dollars (a dollar is a weight of silver) a week, and he did o.k., so I am happy/unhappy about taking this job for X dollars a week.” Or variations thereof. In an inflationary economy it requires masters degree level mathematics skills to try to guess what anything is worth, and what the cost of living will be over the next year or decade. So that gives a huge advantage to the elites and screws the less sophisticated. Every day, every week, compounded over a lifetime….
Now ask yourself: What happened around 1973? Nixon was president, what did he do? He went to China, he took the US completely off of the gold standard, and he got drummed out of office in disgrace.
Coincidence?
JP Morgan: “Money is gold, and nothing else.”
John Bogle: “It’s amazing how difficult it is for a man to understand something if he’s paid a small fortune not to understand it.”
This last quote explains why the above might make sense to you, but elude the minds of the president of the Federal Reserve Bank as well as many congressmen. It’s not a conspiracy. It’s just what works in the interest of the high IQ at the expense of the low IQ. Fiat money is fundamentally dishonest of course, but it works well for a one group of people, and not so well for the rest.
Paris isn’t burning because of inflation, its burning because the UE rate is 25% higher than it was in 2008 before the crisis and because rather than peaking in 2010 and drifting down like in the US it peaked in 2015. France had 5 years of recession by UE rate from 2008 to 2015 and the other years were more flat than improvement.
Granted, I shouldn’t use such rhetoric. France does have many problems that the US has – so far – avoided.
@Alchemist
This seems to fit the timeline closer than the usual “It’s Johnson and the Great Society’s fault” or “It’s Reagan and neo-liberalism’s fault”, though in the ’70’s there was still enough union density that wages (while still trailing) kept up with inflation more than after the interest rate induced recession that caused much unemployment in ’82 after which private sector and total union density dropped as automation and completion reduced the number of union factory jobs (plus whole factories being closed and rebuilt in Dixie and then overseas), add in “dual tier contracts” in which new hires get lower wages adds up to head winds for wage growth.
It only fits the timeline if you think that major economic trends are shoved into action basically immediately after an event. Nixon goes to China in 1972 and major reforms in China start in 1978, and US trade with China as a % of US GDP doesn’t track particularly well.
@baconbits9,
I think that trade with China really only came a significant factor after 1999 when they entered the W.T.O., but trade with other nations had impact.
Besides 1973 we have a few nominees for “income peaks”, 1970 (as has been mentioned upthread), 1979 (the year of the second oil embargo and when the Fed induced a recession to curb the wild inflation of back then), and 1999/2000 (as has been mentioned upthread).
What’s not in dispute is that at least until 2014, median wages have been in decline (if you throw in the conceit that medical care has gotten much better over the years you may argue about total employee compensation).
What should be done?
There is no real shift in the US current account balance in the 70s, it starts in the early 80s which makes it tough to claim that a trend that started in 73 was driven by shifts in trade.
This only works if the rate of gold discovery and the demand for gold is constant over time. There is no reason to believe that this is true.
On the other hand the Fed can set a target and hit it within a small range every time. Since changing from the gold standard inflation is much more predictable than it used to be. The decade right after 1972 featured more than normal inflation but since then it has pretty much stayed in the 1-4% range.
On the inflation measures, consider the following toy model:
Over some period of time producer inflation has been zero. Nominal (and therefore real) output has increased by 100%. Consumer inflation has also been 100% (because of a huge increase in housing costs, for example). Nominal wages have increased by 100%. On the usual measure, real wages have been stagnant. Nevertheless, there is no decoupling, because producers have increased wages exactly in line with the increase in their own income.
Assuming that the consumer inflation measure is doing its job, consumers actually are no better off than they were at the start of the period, so they have a real problem. But the problem isn’t decoupling (in the example, it’s increasing housing costs).
In the example (which is obviously extreme, but housing costs have in fact increased over the period in question) the extra value would appear to be captured by landlords, except that most people own their own homes and the rents in question are notional. Which means that the extra value is reflected in higher house prices. And that doesn’t seem wholly disconnected from experience: lots of people have stagnant incomes but significantly increased paper wealth because of an increase in the value of their home. The counterfactual rent of a homeowner should count as a part of the return to capital, but I’m not sure whether this will be fully reflected in the figures.
This is a really good point. I wonder if/how these studies take that into account?
Great post Scott, very educational. I think I agree with most of your analysis, but I have a little push back on point 3 of your conclusions. I’m hesitant to blame 25% of wage decoupling on tax and policy changes, when it has came and went several times in the last few centuries. There was no income tax at all the first time wages decoupled, so to me it’s odd to blame tax policy.
I think technological changes are why executives can command higher compensation. Multinational corporations can easily produce good across the globe, and the CEO and other executives can more easily manage more people in further locations. A good Executive is actually worth more to a company now than one was in 1950, since they can control more. You could argue that with the right tax and policies it is possible to prevent Executives to be compensated what they are worth to a company, but I think it’s odd to say that by failing to pass the right tax policy that creates the wage decoupling.
How much of this might be associated with regulatory risk? It was around that time that things like the EEOC, etc., started having an impact as well. For example, just about every job I take starts out with paid mandatory sexual-harassment and anti-bribery training. Even during national emergencies like Hurricane Katrina, already-trained firefighters first had to take an 8 hour sexual harassment training course before they could start doing anything useful.
When you didn’t have to worry about the regulatory risk of such policies, it was pretty easy to take a prospective new hire and point them at a shovel and tell them to start digging. Once you start having hours of training you have to pay them for in order to demonstrate that you’ve put them through the training you start being more cautious of who you hire which *also* depresses wages and employment. And since this is a per-employee related cost, the costs will be disproportionately borne by the lowest-value employees.
I would like to believe this, but if it were true you would expect Alex Tabarrok (who would also like to believe it) to have found that regulatory changes had led to declining dynamism, and he didn’t.
Total employment rate is up since 1973 (though it has decreased from its pre-crisis peak). If regulation didn’t have a negative effect on employment, then it could depress both salaries and producivity, but not their ratio. To put it in another way, some of the product of your work may go to a sexual harassment trainer, but that’s still counted in labor.
You conclude that an increase in the supply of labor from women entering the workforce could be a causal factor around the beginning of the decoupling in 1973. Couldn’t the continuation of that decoupling also be caused, or at least exacerbated, by another massive increase in labor supply from the large wave of immigration that followed? This Yale study found that there are 22 million illegal immigrants in the US, and that is a lot of extra workers for even an economy the size of the US to absorb without wage declines.
https://insights.som.yale.edu/insights/yale-study-finds-twice-as-many-undocumented-immigrants-as-previous-estimates
This only works if you can in fact prove this wasn’t also true before recent times, which I don’t believe is the case.
You don’t believe that the number of women with jobs and the amount of immigration increased (though has decreased again over the last 5-10 years) in recent history? Just look at the publicly available statistics.
This is well known. There was little illegal immigration before the 1970’s
If it’s labour force effects, I’d wager women have had a much bigger effect than illegal immigrants. Illegals coming across the borders are consumers as well as producers, so their presence creates some jobs. Women were already here, so there’s no net jobs added by them moving in, but their labour force participation went up dramatically.
The 1970s are also an inflection point for legal immigration.
What we could be seeing is that a bolus of labor 1960-Current via women entering the workforce and increased legal/illegal immigration starting around 1970 had an inflection point in 1973, which is where the median worker started being affected by this influx.
Using a labor theory makes a bit of sense because on “The Chart” aka the first one, labor was actually trending to surpass capital growth, then it drops in trend pre-1973 and then 1973 is chosen as the point of separation (you could also choose 1970). But, if we imagine that without women & increased immigration we had a trend where there would be a huge gain for labor & wages 1965-1980, and that effect still continued for the US Born men through that time period, but there were a lot of people coming in at the bottom that would explain a lot.
I was disappointed that the first occurrence of the string “immi” was in the comment section. I have no idea whether immigration is even a partial cause of the decoupling, but it seems to me like an obvious avenue to investigate. Illegal immigrants are probably willing to accept lower wages, but in my view the effect of both illegal and legal immigration should be considered, because increasing the supply of labor is probably the most relevant mechanism whereby immigration affects wages.
I take the point that immigrants also represent new customers, but I would expect them to be on average poorer than the average citizen, and so their net effect could be a downward pressure on wages.
I think it is because a lot of people do focus on illegal immigration, which is fair to point out as probably too small to impact that much. On the other hand, legal immigration dwarfs it in size, and they too accept lower wages. That combined with more women in the workforce, means the low-skill labor supply has probably doubled compared to a baseline where there was 0 immigration and 0 liberalization. This would certainly drag down the median wage, while probably not affecting topline all that much (maybe even helping it go up).
Yes, this is my view. I dont have fancy graphs or sophisticated economic arguments in support, but to me it seems plainly obvious that this should be a prime suspect.
Basically Democrats support immigration for the votes, and Republicans support immigration for the higher profits driven by lower wages and new customers.
It seems to me also the timeline of the decoupling is compatible with this theory, with immigration becoming widespread right around 1970.
The immigration patterns don’t fit. Sure immigration started to rise sometime during the 70s but immigrants as a % of the population in 1980 was lower than in 1950.
That immigration pattern would certainly support an inflection point happening in 1970, particularly if it was compounded by females entering the workforce.
When you start from the 14.7% datapoint, what we are seeing is not only the % of foreign borne population, we are seeing a decrease of inexperienced recent immigrants, which is what would be the most significant pressure on the labor supply. Most of the people in the 1920 set are out of the workforce, or seniors on the verge of retirement by 1970. They no longer have an effect on the supply, particularly on the low end.
If the correlation is higher immigration holding wages down then the expectation would be that the lower immigration rates would boost wages. The previous high immigration period would have held wages down and then you would expect catch up growth with the lower rates where wage growth exceeds productivity growth.
Doesn’t this have the same problem as the minimum wage erosion theory, namely that it can’t account for the stagnation reaching all the way up to at least 90th percentile? On any plausible theory of the typical division of labor between immigrants and non-immigrants you’d expect the 90th percentile folks to be among the beneficiaries of immigrant labor.
And we simply don’t know the answer because people always start their metrics on things like this postwar post-depression because the assumption is that those things are too disruptive so everything before and after is discontinuous.
However, anecdotally this would not be true at all. People will recall that the early 1900s were infamous for protests against capital and the excesses of the rich, around the same time the % of the country was immigrants was also high. We also know that a political revolution (progressivism) started in the big cities where there was high % immigrants, and that became an ascendant coalition. So too do the Democrats of today believe they will have a similarly ascendant coalition based on the votes of immigrants and the children thereof. Current America looks very much like the America of 1920 or so.
@Scott Alexander,
Thank you so very much for posting this!
My main interest is median wages relative to the pricr of housing, then the price to visit a physician, then the price of education.
My understanding is that the C.P.I. adjusts for such things pocket calculators and cell phones being relatively cheaper than they once were, and things likr washing machines getting more efficient, but what I wonder about is wages relative to the static good of lsnf and a house.
My parents bought a house in 1972, in Berkeley while working intermittently as haulers and roofers (mostly my Dad but sometimes my Mom would pitch in), when my Dad was in his early 30’s and my Mom in her mid 20″s. When me and my wife bought a house it was in 2011 after a financial collapse caused a short dip in skyrocketing housing prices when we in our mid to late 40’s, none of my peers growing up here stayed in town and bought a house, with almost all of them having a lower standard of living than their parents and often grandparents had at the same age.
The house me and my wife got waa smaller and older than my parents house, though I suppose it could be argued that the refrigerator is fancier, and some of the pipes were copper instead of steel, but the water heater and furnace really were even older versions of their 1970’s equivalents so I don’t buy any stories about stuff being “updated”, it simply took decades more labor hours to get a smaller older version of what my parents had in ’72.
A bigger chunk of my wages goes to pay for health insurance than in years past and if my son’s are privileged to get to go to college like their mother did it will cost much more.
As far as I can tell those younger than me have to pay an even higher percentage of their earnings towards rent than I did at their age.
This sure feels like declining living standards.
But the phone I’m typing this on is pretty neat.
How common is my experience?
I think your experience is rather atypical, because you’re in what is almost certainly the worst real-estate market in the country. There are lots of people who want to move to the Bay Area, and only a limited amount of space to put them in. This is obviously going to drive up prices. I’m looking at being able to buy a house at about the same stage of life that my parents did, and for a similar fraction of my income. But I’m also in the Midwest, where land is cheap and the city can spread out.
Actually, this kind of thinking might be a driver of a lot of our problems. These days, lots and lots of influential people live in a few big cities with fairly specific problems (NYC, LA, SF, maybe Seattle and DC) that aren’t nearly as much of an issue for most of us. And then they attempt to impose their solutions on the rest of us.
The only solution I can think of is to try to make these cities less attractive by moving more of this industry out into places that aren’t hemmed in and overcrowded already. We’re seeing some of this with places like Austin and Nashville, but I’m sure there are other options.
@ Plumber,
My survey-of-friends-and-relations (exhaustive, exhausting, and totally biased and non-scientific) data says that your experience is typical. I also think that Bean is correct in that my coastal-blue-state experience and yours might be significantly different than the flyover country situation, where you can still buy a nice house, pay state college tuitions for a decent education, and buy cheap food and electricity &c. and wages are lower than ours in absolute terms but much higher compared to expenses. As I detail below, I believe that an economy with an inflationary currency inevitably reduces wages of productive people over time and shifts wealth and returns to unproductive rentiers and also to capital. As far as I can see your intuition is correct. My sisters and I are in similar situations. The few exceptions I can think of managed to avoid college costs and at the same time find a lucrative career in sales early on and then become asset owners. Granted, that has always been a path to wealth, but the ability of college professors, doctors, teachers, plumbers, &c. to cover basic costs – housing, food, medical, education – seems to have changed dramatically even since I started working full time in 1987.
“Cost to visit a physician” is also somewhat misleading. If you have cancer, for example, it’s not clear that paying 1973-era medical costs for a 1973-technological-level oncologist would be better than paying 2019 costs for a 2019 oncologist.
To others’ points about housing markets, we would expect that the kind of housing market stratification we’ve seen would exacerbate the inequality effect of skill-biased technological change. If the fraction of people who can afford to move to an innovation center goes down, and the return to being in an innovation center goes up, you’ll see the lucky few who can still go make their fortunes in the innovation centers (among whom I count myself) getting much better off relative to everyone else, because they (we) are both disproportionately more productive and face disproportionately less competition.
My father worked in finance and then transitioned to IT in finance later in life. He and my mom bought their first home in their early 40s in a bedroom community (not even really a suburb) about an hour drive away from his job downtown (blue city-red state). It was one of those subdivision mass-market developments where all the houses were crammed in close to their neighbors and was a 3/2. He worked many 50+ hour weeks.
I work in the same city. I bought my first home when I was 25 working part-time in a call center with my wife working part-time in a coffee shop. I am within city limits and 10 minutes from downtown. My home wasn’t built new when I bought it, but it was less than 12 years old. It was a subdivision, but only about 3-4 blocks of homes were with that set of plans and there is ample space between homes (my lot is between 1/4 and 1/3 acre and I back up to a forested area). It’s a 3/2 with a bit less square footage than my parents, which I have turned into a 4/2 and larger by remodeling the garage. In my neighborhood and adjacent ones live five other households of my friends that we knew in college and semi-coincidentally all bought in the same neighborhood.
I don’t think my experience is typical, but I do think we made different choices due to different values, even within the same family.
EDIT: Hrm, reread your post and did the math @Plumber. You actually may be only slightly younger than my parents. They were born in ’60. So maybe it is just your generation that got whacked.
@etheric42,
You bo bought your house at 25?
Congratularuons that sounds awesome!
Your math was right, my wife and I were born in ’63 and ’68.
Of course any discussion about labour vs capital share of gdp needs to talk about land as well. So ‘5. Could Wage Decoupling Be Explained By Increasing Labor-Vs-Capital Inequality?’ would be more interesting with land.
That also came up in the discussions around Piketty.
Couldn’t that problem be avoided by just using nominal GDP per capita/labor productivity/wages/total labor compensation? The individual nominal numbers wouldn’t be meaningful but the ratios between them should be and shouldn’t suffer from the distortion of being adjusted with different indices. Has anyone done this?
Even if the unadjusted data isn’t available, it shouldn’t be difficult to just remove the index from the data if you can find the CPI/PPI data from somewhere. I’m too lazy to do this however.
On point 7, the other aspect referenced in those papers may be between firm inequality related to things like winner take all effects and outsourcing, not just technology. http://conversableeconomist.blogspot.com/2017/03/how-between-firm-inequality-drives.html
Between-firm inequality is what I came here to point out – it’s empirically not enough to just compare Apple management to Apple workers while comparing Walmart management to Walmart workers. If Joe Bob’s Fix-It is paying all their employees the same precarious wage while Susan Calvin’s ML Consulting is paying all their employees the same exorbitant wage, that still shows up as a big productivity-vs-median-earnings discrepancy, even if it can’t be squeezed into a management-vs-labor narrative.
I find it depressing that this is all single nation analysis when there is obviously an effect of international business. If a US company can be responsible for production that is occurring in China, and that revenue is showing up in GDP, wouldn’t that make the productivity number for the US shoot up while the labor income is flat, while part of the “missing labor income growth” would be in China? I am sure economists have some magic way of dealing with this, but I am not convinced it works or is used in these numbers.
Theoretically foreign production should show up in the GNP (Gross National Product) but not in the GDP (Gross Domestic Product). I don’t know if there are possible accounting quirks that might make foreign production to appear to boost domestic producivity.
Thanks for the write-up! Have you seen the evidince tying this to other demographic changes, namely the aeging of the economy? This would also explain why it’s happening across developed countries.
https://www.nber.org/papers/w25382
https://www.vox.com/a/new-economy-future/aging-population-slow-growth
There’s a helpful therad from Lyman Stone giving a summary of the argument: https://twitter.com/lymanstoneky/status/1082178472766713856
This point is one I’m wondering about. In 1950 there were over 16 workers per retiree but by 1970 it had dropped to less than 4:1–and now it’s less than 3:1 (source). That seems like an important demographic shift to account for. Also, @floplo has a comment above considering how much of the shift in the balance between labour and capital stems from the increased importance of pension funds.
1) One factor that should probably be mentioned here is 1980s-era tax reform. Rates were famously high before Reagan, and dropped massively during his tenure(from 70% to 28%). This was much less of a tax cut than it looks like, because an immense number of loopholes were closed at the same time, so a lot of tax dodges that rich people used pre-Reagan were no longer available, and the top rate was closer to the rate that actually got paid. Here’s a graph of tax revenue as %GDP. Note that it dropped slightly under Reagan, but not much. (As a side note, this happened across much of the developed world at similar times, so it’s not a US-only phenomenon – note Thatcher, in particular.)
My understanding of compensation for high-paid employees in that era is that a lot of it was in things like company cars pre-Reagan, because they were untaxed. Post-Reagan, they were taxed, so the compensation moved towards salary instead. While total compensation measures should theoretically adjust for this, I’d wager that salary data is way more reliable, and that pre-Reagan perks were probably not taken into account to the same extent. So as a result, some of the wage inequality effect may be an artificial impact of policy changes, not a true change to actual compensation.
2) The dominant sectors of the economy have shifted. We do a lot more finance, medicine, and tech than we ever used to, a lot more minimum-wage service industry work like call centres, and a lot less manufacturing(in employment terms). The new sectors are either dominated by a giant mass of people paid the bare minimum, or by small groups of elites whose productivity is about as high as humanly possible, whereas manufacturing was often midway between the two. That implies increasing “productivity inequality”, which will inevitably be reflected in wage inequality.
3) I don’t know if this is relevant or coincidence, but look at athlete salaries over time. The salaries earned by top athletes have spiked tremendously, particularly from about 1980-2000 as I understand it – https://www.firmex.com/thedealroom/when-did-athletes-start-getting-rich/. I don’t know what conclusions to draw from this, but it seems like an area where some interesting conclusions can be drawn.
Dear Scott, I believe you have underestimated technology’s impact on wage decoupling because of a misreading of the Brynjolfsson and McAfee paper.
The Brynjolfsson and McAfee paper actually identify two distinct
“technological change effects*, which may explain your confusion.
One is making high-skilled workers more productive (payroll
software, computers, etc), but the other is making
*ultra*-high-skilled workers *far* more productive by allowing
the global diffusion of top 0.1% innovations (Facebook, Snap, Apple,
what have you). The former is the “computers let you work faster”
effect and the latter is “computers let you build Facebook and make money from a
billion people” effect. Brynjolfson and McAfee are arguing that
it’s the second effect that dominates, which neatly explains why
the lion’s share of wage growth accrues to the top
0.1% which you mention in part VI. Technological growth causes increasing wage inequality.
The figure that shows the changes in real wage levels by
education is not fine-grained enough, which leads one to draw
the wrong conclusion that “education doesn’t explain wage
decoupling”. As Brynjolfsonn and McAfee mentioned, it’s not the
“computers let you work faster” effect that explains
productivity growth: it’s “building Facebook” that counts. But
evidently just having a postgraduate degree won’t give you the
skills you need to create a global innovation. The people who
are driving the top growth (and are paid commensurately) are
far, far more selected than that; lumping them together with the rest of the “> Bachelor’s degree” will obscure their real wage growth.
But disproving all causes of decoupling is exactly what the point of the paper is! Summers and Stansbury claim there is no decoupling. The headline results are as follows:
Divergence between productivity and typical worker’s compensation (median compensation): None.
Divergence between productivity and mean compensation (decline
in labour share): No divergence until 2000, until capital plays
a larger role in productivity and the share of labour decreases.
So I would amend your conclusion and final numbers as follows:
Technology drives both labour-capital inequality and wage
inequality through providing greatly increasing returns to
ultra-high skill. I would break up “globalisation and automation” into two separate mechanisms: possibly something like
I think this is roughly correct.
Also, I think that some of the effects of technology aren’t as immediate. There are fields like ditch digging where your best worker might be twice as productive. I don’t have numbers for this, but it seems plausible that more and more fields are more like 80:20, where 20 percent of your workers are doing 80% of your work. And technology seems to be opening up fields where 1% of the field’s workers are responsible for 99% of its output – that’s the ‘builds the next facebook sized product’ effect above. What percent of the economy is in which of those buckets isn’t going to track technology super quickly, and it might take generational change to switch buckets. It might take a company that switched buckets slowly outcompeting one that didn’t.
> Apple probably pays its employees more than Wal-Mart does, but not ten times more.
I wouldn’t be surprised if Apple’s median engineer earns about 10 times as much as a Wal-Mart employee. I think the median compensation in Apple is somewhere between 200 and 250 thousand (I’m judging by Google, I think Apple should be similar).
I was thinking about that statement as well. Here’s an inequality between the two I think your question points out–
How much of the actual production of Apple products is subcontracted? My impression is most of the people putting chips to boards are foreign subcon, who are very roughly equivalent to the low paid Wal-Mart greeters and baggers, while the actual Apple employees are basically Wal-Marts top, say, 20%, their accountants and purchasers and so on.
If Wal-Mart imported Chinese that they could pay according to China’s labor market to actually run the stores and stock to the goods–or Chinese built robots–maybe their income/employee & wages would more resemble Apple.
Most Apple employees are retail employees. Still likely to be better paid than the median Walmart employee, but not quite such a stark difference.
Why are we only redistributing the high-paid executives? Shouldn’t we add stock holders, rent seekers etc to this as well if our scope is the entire economy?
A nice thought experiment could be to try to calculate how many people has to be visited by the 3 spirits to decide to share all their income with the rest of the population to double everybody else’s income? My gut says it’s not a lot of people who makes the half of the total income that’s being made.
About 12% of the country would need to be visited. https://taxfoundation.org/summary-federal-income-tax-data-2017/ – the top 10% makes 47.36% of the total national income, so it’s a bit more than 10% to get to the median dollar. (The median tax dollar, on the other hand, is somewhere around the top 3%. Taxes are nicely progressive.)
I’d predict that the sudden beginning of 1973 is caused mostly by the massive change in CPI that year and onwards. In the graphs from the heritage foundation cancelling out CPI there is no obvious point of decoupling, just a slow decoupling from the early-mid 80s. Even if we used the EPI’s numbers I suspect that no obvious start point would be left.
In addition to technology improving productivity and steering wages towards the high-skilled, I’d look to globalization. Where you used to have multiple companies in the same business in different cities, states, and countries, we are now quickly approaching a world with a few, large companies. This will reduce the relative number of top executives and capitalists, while increasing their incomes. (Didn’t I recently see a statistic on time to reach $50B revenues or market cap or something for various companies?) It’d be interesting to see the wage distribution within the different segments (e.g. the top 1% CEO vs the top 10%, or the bottom 10% CEOs vs the top 10% engineers)
At the same time, low-skill jobs in manufacturing are moved to low-cost countries, probably a major reason why wages for low-skilled men have declined, but not for women.
I may be hopelessly confused, but it seems likely to me that a lot of the globalization impact shows up in the producer/consumer inflation discrepancy.
I also see globalization as a large missing explanation, but only skimmed the post. More specifically, the rising trade with labor rich and capital poor emerging economies, e.g. China, and it’s impact on relative factor prices. Standard economic model, e.g. Heckscher Ohlin, would predict both riding GDP and adverse impact on labor income in developed economies. Also the divergence of low paid labor vs high skilled labor upon rising trade, as the low paid labor in advanced economies now competes with emerging markets labor pool via trade, but high skilled labor is via trade exported to emerging markets where skills are less abundant, so would do better income wise.
Might want to track labor income in emerging markets, and share of trade.
I believe that globalization has made a big difference, especially given that the period from 1975 to now has been a long series of increasingly large low-wage countries entering the world market. Looking at aggregate economic figures for the US over that period is like looking at aggregate economic figures for California — the system is nowhere near self-contained. Indeed, if you incorporate all the Chinese into the various categories, it’s not at all clear that wages for low-educated workers have been stagnant since 1978; wages in China must have risen by at least a factor of 7 since then.
You can just do the math with nominal data. I’m seeing a “gap” of only 15% from 1984 to 2017. So yes — most of what you’re discussing is an artifact of nonsensical inflation adjustments. (Or it all happened in the 70s.)
Calculations (all nominal, meaning not inflation-adjusted):
1984 GDP per capita: $17k
1984 median household income: $22.5k
1984 population: 236mm
1984 household count: 85mm
-> 1984 persons-per-household: 2.78
-> 1984 median-household-income-per-person: $8.1k
-> 1984 [median individual income]/[GDP per capita]: 0.47
2017 GDP per capita: $59.7k
2017 median household income: $61.4k
2017 population: 326mm
2017 household count: 128mm
-> 2017 persons-per-household: 2.55
-> 2017 median-household-income-per-person: $24.1k
-> 2017 [median individual income]/[GDP per capita]: 0.40
So 0.47 -> 0.40 is the decline in [median individual income]/[GDP per capita]. That’s 15%. (Or equivalently, income would be 18% higher if it had “kept pace”.)
This analysis assumes that median household size declined at the same rate as mean household size. Unfortunately I could not verify.
Why did none of the cited papers do this calculation?
https://fred.stlouisfed.org/series/MEHOINUSA646N
https://fred.stlouisfed.org/series/A939RC0A052NBEA
https://fred.stlouisfed.org/series/B230RC0A052NBEA
https://fred.stlouisfed.org/series/TTLHH
P.S.:
You should never say that about a macro paper. This is a field that is capable of believing extraordinarily wrong things for extraordinarily long times. Many papers “of significance” are super dumb about at least one important thing.
Whoops, I’m dumb. I should be adjusting to workers-per-household, not members-per-household.
1984 total employment: 103mm
-> 1.21 workers per household
-> $18.6k median income per worker
-> median income/gdp per capita = 1.09
2017 total employment: 152mm
-> 1.19 workers per household
-> $51.6k median income per worker
-> median income/gdp per capita = 0.84
A decline of 1.09 -> 0.84 is 23%; or equivalently, median individual income would have been 30% higher if it had kept pace with per capita gdp. Extrapolating the same rate of “gap widening” out to 1973, we get that median individual income would have been 42% higher.
So, updated verdict: there’s something here, even though faulty inflation adjustment is clearly the most important piece of the face-value claims. (I guess that was basically the conclusion of your post already.)
http://www.dlt.ri.gov/lmi/laus/us/usadj.htm
No, GDP is per capita, not per worker, so income should also be counted per capita. Original was right.
One more mystery: if all of this is true, why isn’t small business formation higher? After all none of these factors (besides mismeasurement) applies to you if you have a small business.
But if anything, business formation is down.
(Also, the charts by educational attainment are meaningless. There has been a huge shift within categories. Being a high school dropout in 1960 meant something completely different than today)
I suspect increased societal risk aversion has a lot to do with decreasing business formation rates. (This would also be expected to increase expected returns for people who do decide to assume risk, which will again drive inequality higher)
Is it? I’d believe it, but I also don’t know.
Assuming it is, though..
One part of it seems differences in the market. What large company of today are you going to compete with? The success story of the modern world is in the tech giants; what small business can you form to compete with Google, Facebook, or Amazon? They are largest in large part because they already are, because everyone uses their products already, and because it is cheaper for them to replicate the things they do well than it is for you to provide them locally.
I’m not sure what else to think of this. In a world with more small business formation, what sector do you see them pop up in? Which people do you assume would form them?
Interesting Is it possible that increasing obstacles to small business formation, such as increased returns to scale or increased regulatory load, is one of the causes of the observed decoupling?
I’m wondering if the skyrocketing share of finance in terms of total profits has something to do with it. The timing seems close to right (especially for the steeper post 2000 trend). I can’t super easily think of an easy cause but the super rough thumbnail would be something like: capital and labor used to be somewhat tied together on a company level. If the company did better there were more company level profits to be shared with workers or locally (I mostly mean within the company) reinvested. But as finance takes a larger and larger share of total GDP, there aren’t company level profits to distribute to workers. So “efficiency” for some reason is accruing almost totally to finance.
I don’t think I’ve seen a good explanation for why finance recently gets to take so much. Suspicious me thinks that those who control what gets funded make sure you have to pay then increasingly large shares to get funded, but operationally I’m not sure how that would work. I am convinced that whatever it is probably a kind of hack, because increased marginal gain in funding matching can’t justify enormous growth in terms of matching efficiency. The low hanging buyer to seller mismatches have eventually been picked. It’s like increasing the compounding rate of interest. Compounding annually, is noticeably less than monthly is less than weekly, is somewhat less than daily, is a bit less than hourly, is just a bit less than instantaneously because it’s a limit function.
We’ve spent a lot of time in recent decades analyzing stock markets/investment theory, making it easier for less-wealthy people to participate in the market, and reducing transaction costs (especially with computerization). That means there’s a lot more money that can go to the finance sector, and a lot more that the finance sector can do with it, while lowering overhead costs when they do. It’s also an auction/tournament system, where rewards to skill are limited only by the size of the pools of cash you can accumulate, so as portfolios grow then the compensation will also grow correspondingly. So it doesn’t surprise me at all that finance sector compensation has gone up so sharply.
Maybe I’m misunderstanding you, but that sounds like an explanation for why there are some big winners in the finance sector (they have increased the amount of money by increasing the size of pools of money by increasing the customer base). That doesn’t explain why the finance sector has hugely increased its share of total profits relative to all the other ways of making profits.
Put a different way, I understand the social value of profit in the Microsoft case—they made a lot of money providing personal computers which did a lot of good. Finance is second order, they make a lot of money facilitating the ability to create companies which might provide goods and services that we might see as doing a lot of good. It isn’t clear to me that they have done so much a marginal difference in facilitating the ability to create companies which provide goods and services that is should result in tripling their share of the profits. Is the ability to find capital so much better (and for reasons due to financialization as opposed to mere communication advances) that we should see such a huge shift in who gets the profits? I’m skeptical.
Thank you for posting this, I was having more or less the exact same thoughts while I was reading the post.
I seem to recall that back when the Scott posted his article on rent seeking some people mentioned the finance industry as a place where a lot of rent seeking was taking place (or maybe I just thought it…perhaps I’ll go back and re-read that thread tonight to see if I’m remembering correctly). To expand that, even though it wasn’t explicitly mentioned by Scott in his list of explanations, I wonder how much a large increase in successful rent seeking (not limited to finance) can help explain the wage decoupling (or is rent implied as an underlying part of the issue for some of his proposed explanations)?
Worth noting, I work in finance, but I’m in the advice and planning side, not the money management side, so I’m seeing this indirectly.
That said, a few reasons come to mind:
1) Finance inherently reflects wealth concentration elsewhere in the economy. Any concentration anywhere else flows through to finance almost instantly, so we’ll always be at least as concentrated as the economy as a whole. (This may seem a bit counter-intuitive, but most finance these days is aimed at high-net-worth clients – even formerly mass market firms have been abandoning poor people, because the margins aren’t there.)
2) I’m pretty sure computerization has had a gargantuan impact. Costs are far lower, and ability to transact is far higher, than it was 50 years ago. That improves potential profit margins. (A lot of that flows to labour, not to capital, but the sort of labour force that it flows to is 1%ers, so it’ll still show up as inequality).
3) Globalization means that you can tap more of the world economy more easily than before, increasing possible returns to scale. This has shown up in consolidation of markets (a lot of smaller stock markets closed down in the 90s, as I understand it, while the biggest ones got far bigger), which will result in smaller numbers of people making more money just like #2.
4) As society gets wealthier, our ability to consume material goods has not kept pace. Instead, we’ve increasingly started consuming services. My current job didn’t exist 20 years ago, and now every big bank in the country employs dozens of people like me for a pretty niche job. I suspect this has happened in many places throughout the industry – more money is chasing better service and higher returns, and it’s shelling out to get them.
5) The insanely high, and ever-increasing, regulatory burden on the entire finance industry is almost certainly crowding out smaller competitors. A less competitive marketplace means higher margins for the remaining players.
6) I suspect there’s a bit of a bubble effect going on in stock markets. Finance is always very pro-cyclical, so if we’re in a good market, finance will do better than most.
We still seem to be talking past each other but that’s likely because I’m not being clear in what I think the distinction is. You list all sorts of reasons why one finance company might get rich compared to other finance companies. You outline a bunch of ways which small marginal differences might combine to make certain finance companies much more efficient THAN OTHER FINANCE COMPANIES such that a few winners might get a sweepstakes effect and become super rich. I understand that, and for the most part I’m fine with that (caveats about the systemic risk of letting things get too big to fail aside).
That doesn’t explain why finance should dramatically increase its share of total profits as against other non finance firms.
We often hear that high marginal tax rates disincentivize investment—why work so hard to get a return that the government gets most of. But the same is true of an increasing share to finance. If financial firms get almost all of the growth in an economy (and by the accounts I’ve seen they got a huge percentage of growth since the crash) it should be seen as having exactly the same kind of disincentive as a tax. In many ways it is even worse than a tax, the government on,y gets a percentage of net profits, while finance gets paid huge amounts even if the company makes no net profit.
Don’t get me wrong, I’m very capitalist oriented. Useful finance is important, but its important in a capitalist society because it facilitates consumer oriented companies. If it ends up getting too much of the profit share, that ends up disincentiving the good work that we want to have happen, at least as much and arguably MORE than a high tax rate.
Not one of my reasons fits that description. All of them are intended to describe industry-scale effects, not firm-scale effects. I feel like this might be a miscommunication, so let me ask: which of those sound like firm-scale effects to you?
I’m not sure you’re using “industry effects” in a way that makes sense to me. Do you mean something like “factors specific to the finance industry as a whole which explain why it should dramatically increase its share of total nationwide profits compared to production companies”. Now admittedly that’s already a little tricky because they’d say “we produce financial products and services” which is true, but the finance sector that we are talking about functions (at least in the good capitalist story) as an intermediary for first order producers of goods and services to gain capital inflows.
Taking your points one at a time (with the parenthetical descriptor to be reminding me of which point is which, not a straw man summary of your point).
1. (Mirrored concentration). I don’t think this point is true. There are pretty prominent counter examples, especially the gilded age where railroad, steel, and oil producers were supreme. Your explanation for why it should be true seems odd too. Unless there is a lot of churn or rent seeking (which would suggest bad financial intermediation) there isn’t any reason why large fortunes flowing through the financial sector should mean that the financial sector should capture more of the profits than they used to.
2. (Computerization)To the extent that computerization makes financial companies more efficient, use argue for driving their share down—computerization should make it EASIER to match capital to business needs. If a few financial companies have much better tech, it would make sense that they could outcompete other financial industries and get a bigger chunk of the financial share of profits, but it doesn’t explain why the finance industry as whole should absorb a vastly larger percentage of profits of the whole economy. This is especially true if we buy the explanation that the financial sector increases growth by facilitating the growth of outward facing productive industries. That would suggest that growth must be greater in this time of much better finance. But that’s not the case.
3. (Globalization) Again, I understand how it makes for a winner take all dynamic within sectors (one or two players become big and get most of the profits available in that sector). I don’t see why it means that the finance sector in general ought to grow (as a percentage of overall economic profit) compared to other sectors.
4. (Services) I’m having trouble seeing how this explains greater finance share. Finance has always been a service intermediary between people who wanted to invest and people who want to get investment. Paying a much larger percentage to mediate less growth than finance made in earlier years seems the exact opposite of the increased efficiency/scale/technology story. And it isn’t in the salaries of the mid level workers anyway, because that doesn’t show up in finance industry profits (your salary is a cost). So if there really are lots more mid to low level salaries being paid, it makes the huge increase in finance industry profit look even weirder—it means rich people are paying much more finance profit AND much more finance salary AND getting much lower returns than back in the old days of less efficient finance. That’s weird!
5. (Regulatory burden). This one has some explanatory power. Basically regulatory burden shuts out competition so the financial sector can recently charge monopoly type prices.
6) maybe though I’ll not well positione to know why finance might be more bubbly than other sectors.
Bringing it back to the original topic. If the financial sector really is getting a huge increase of profits, it might function as a tax on investment returns, disincentivizing investment in non finance salaries or non finance projects.
Ghillie Dhu, the only time finance share of profits was at or near 30% was just before the recent crash and now. Most of the rest of US history it has been 10% or below. So it appears that finance is getting a huge share of the profits, and that this phenomenon is relatively recent.
Perhaps not just ability to find capital, but ability to allocate capital well.
You’re limited by market liquidity. You might find a trading strategy that works really well, but you can’t fill out that trade infinitely. You’re not trading with the entire market, you’re buying at the marginal price, which represents a small fraction of total participants.
That’s why there are so many day traders who make a consistent living around $50-100k/year, but never really go any higher. Their strategies aren’t scalable, and it takes sufficient labor to find these strategies that people find it difficult to double up and find more strategies than their peers to earn $100-$200k/year. They can’t simply double their portfolio to earn double profits.
It’s significantly easier to get huge multipliers on $1e3 than $1e8.
Why has worker productivity increased? I can think of a lot of possibilities.
a) changes specifically in the workers: workers are better trained, harder working etc.
b) local and global changes outside the company – better communication, transportation, etc.
c) non-capital changes inside the company – better organized, better managed.
d) capital changes inside the company – the owner invests in technology that makes the workers more productive.
Is it possible that the top 0.1% are responsible for most of the productivity growth now, and that is why they have experienced the greatest increase in their compensation? Maybe productivity of the bottom 99.9% has gone up 50% while the productivity of the 0.1% has gone up 600%. Considering the available tools these days with the Internet, etc., to quickly reach a wide audience, raise capital, etc., this at least seems plausible as a thought exercise. In that case it wouldn’t be fair to compare the mean productivity with the median compensation.
This is theoretically possible, but I think the arguments in Part 7, especially that technological progress is anticorrelated with wage decoupling, make it less likely.
Is there a reason you assume that causal interactions must be observed at 0 time lag? Why couldn’t capital investment depress wages 5 years later? Wouldn’t you expect high wages (high labor costs) to drive capital investment?
Overall, my gut is that the main problem with the analysis is that there are too many degrees of freedom in the theories for the data to be able to discriminate between them.
Just think how little data we have. Even if you had daily data for wages, GDP, whatever, at that resolution points are extremely highly correlated. If the trends you’re trying to pick up on are multi-year phenomena, you might have 20-30 “real” data points between 1973 and today. That’s not really enough for an autoregression model, let alone a multivariate analysis.
I understand that skepticism doesn’t publish papers, but it should have been a red flag that so many different authors think the data fits their story. Yes, you can argue about who adjusted CPI more correctly, but this kind of mess is exactly what you should expect an unsolvable problem to look like.
The conclusion should be a high confidence that no one has a generalizable theory.
This is anecdotally based, but my perception is that there are a lot of jobs which are not significantly more productive now than they were in 1967. Why should they pay more in real wages? It would be interesting to disaggregate the data and look at different sectors of the economy.
One reason such jobs might pay more wages is that if there are other jobs that require a similar skill and are more productive and pay more, then people shift to those jobs unless the jobs that are not more productive also pay more. So assuming that the jobs that haven’t changed still need to be done, they will raise wages. See Baumol’s cost disease.
Example (myself, of course) of the uncoupling. This is specific to one area, but friends in unrelated fields who do similar things report the same.
I work in healthcare fraud detection. In the past, the way this was done was to have a nurse look at a summary of every claim and decide if she though it was right, or wrong, and if wrong, in which direction.
Two examples make this easy to see:
Example 1: 24 year old male gives birth. Is it wrong? Yes. What’s probably wrong? He’s probably not a he, and when corrected this becomes 24 year old female gives birth, and was correctly paid.
Example 2: 92 year old diagnosed with a venemous snake bit and sepsis, discharged to home, alive, the next day. Is this wrong? Yes, patients don’t recover from sepsis or snakebites in a day that require antivenin. What’s probably wrong? Patient probably died.
Example 3: 19 year old male with the exact same claim pattern as Example 2. Also wrong, but in this case it’s more likely that the patient didn’t have sepsis, because while it’s likely that a 19 year old will respond well and be discharged the next day, its implausible for a 92 year old.
But why do all of these matter? US health insurers initially assume that claims are correct, but also build in numerous validations, both internal to themselves, and outsourced to payment accuracy vendors. These separate groups then get paid for each dollar they find that was paid in error, while maintaining some accuracy levels. For a deeper dive (without having to hire me), look at the CMS Recovery Audit Contractor program.
But what does that have to do with Productivity?
In this field, we measure productivity as a function of claims reviewed and dollars recovered per work-hour. If we audit all three examples, we’ll have a 2/3 false positive rate, and only recover on the last one.
But here comes the magic of machine learning: what if we can predict which claims will be wrong, and not only wrong, but why they’re wrong? Then we can tell the auditors to look at fewer claims in total, while also increasing their velocity, because they only have to check the things the are likely to be in error.
This will result in an apparent productivity increase for the workers, but which now requires data scientists in addition to nurses.
And what do you know, data scientists are making a lot of money right now, because (at least in some sectors) that’s the next readily available step.
You may also be thinking how much money is really on the table with this sort of thing: 2017 I brought in +$150M on top of what a 39 year old company was already doing, increasing erroneous payments found by about 25%. I didn’t stay to see how 2018 ended, but it should have been higher.
When you translate those dollars back, you see that a small number of people can act as force multipliers on a much larger workforce – sometimes at trivial costs (my examples) and sometimes at higher but still profitable costs (think fast food ordering kiosks).
We have a large number of sectors that are ripe for this sort of transformation, make some minor changes and drastically increase productivity for many people, while also removing the need for some.
Commenter writes he’ll make two examples, lists 3. Is this wrong?
More seriously, I don’t exactly get the examples. These look like data entry mistakes, not fraud. Or do you mean that the third one got unnecessary or fictitious treatment for sepsis?
2 vs 3 examples: the chaos of having small children at home, ceaselessly interrupting everything.
Data entry error vs mistake: here I need to apologize. I had my “talking to doctors” filter on, not my “talking to smart generalists.”
Most inpatient hospital claims are paid by diagnosis, not by treatment itself (I can explain why, but it’s not pertinent here). Sepsis is one of the most expensive diagnoses, is not susceptible to typographical data entry error, but can be easily confused with other infections.
What happens is that a hospital network will hire a “revenue cycle enhancement” specialist, who will identify instances with a plausible argument for error, and ensure that all errors are ones that increase hospital billing.
On the egregious end of this, you’ll have found Hospital’s where every patient with pneumonia also had sepsis, and every newborn had neonatal hypoglycemia or respiratory distress syndrome.
For context, the neonatal hypoglycemia is when a newborn is incapabale of processing food which results in low blood sugar) with the “plausible” cover that they really just diagnosed a newborn who was hungry after delivery and so had low blood sugar before the had their first food. The sepsis/any other infection overlap is similar, as most infections with cause elevated temperature and white blood cell count, which are two of the primary diagnostic criteria for sepsis.
These particular examples are common in the hospital mortality literature, so most hospitals have programs in place to prevent them.
But wait, we read stories about how expensive IV bags and such are often listed on American hospital bills, part of which are then paid by insurance if the patient has one. When you say that they are paid by diagnosis, not treatment, do you mean only the general charge that goes towards the doctors’ salaries and such, while medicines and other single use items are charged separately?
It must be a small number of people on a much larger workforce. If the 39 year old company had consisted of four auditors your contributions would have been the equivalent of hiring one extra auditor. Probably not cost-effective at your rates vs their rates.
But the average household size has decreased since 1973. We should be comparing income per person over time, not income per household.
Household-based statistics have always seemed like such a bizarre way of gathering data to me. I’m really looking forward to the day where we gather and compare information per person instead
It sometimes makes sense to look at household-level data. For example, whether each household has someone earning income is more important than whether each person is working. A 50% adult employment rate is fine if the entire society is organized into 2-adult households; it’s a disaster if the entire society is one-adult households.
Not quite, as all other things being equal it’s cheaper for two people to live together than to each have their own apartment.
In some cases the total income needed for a household to have a given standard of living is assumed to scale roughly as the square root of the number of people in it, e.g. in this table.
I would think for the purposes of this analysis, I’d want to know average income per employee (and person) rather than household. (Well, maybe all three).
If the average pay per employee and per person tracked gains in productivity (which they probably don’t), but households have gotten smaller, then I would view that as a shift in consumption patterns and not really something that needs to be addressed at a policy level. (Or if needs to be addressed, maybe we should be looking at nudging people back towards larger households).
If the average pay per employee tracked productivity but per capita employment was dropping, I’d see that as more of problem, but it might give me more clues where the causes might be.
Agreed. How much the change in my share of the encomy affects me depends on my living arrangements, but that doesn’t help make sense of the data as to where the gains in productivity are going.
My understanding is that they often track the numbers this way because that’s how the government collects the statistics for tax purposes. Thus, if you measure by household you can link into tax statistics provided by the federal government and get long-run data that go back decades before you became a researcher. Since you’re measuring rate of change over time, you want to go back as far as you can.
The problem with this approach is that the only way to file as Married Filing Jointly is to actually be married (or fraud, which should be a small percent of the data). Thus, you see an increased number of people co-habitating but not married over the last few decades. They share a home, finances, etc. But the data increasingly sees these families, which are de facto the same, as distinct entities.
Say you sampled a random neighborhood in 1950 and asked about household income. You see 100 households, of which let’s say 65 represent married couples and 5 represent couples co-habitating. Fast forward 65 years to 2015, and the same random sampling gives you something more like 40 married couples and 30 couples co-habitating. They all share the same financial situation, but in the older data set you are averaging wages over 75 ‘households’ (the co-habitating couples will each file their taxes separately, so 65+10) versus the new data set averages wages over 100 ‘households’ (40+60).
The argument is that the output is based on a ratio, and the reason the output is getting smaller could be because the numerator is getting smaller, or it could be because the denominator is getting bigger. My understanding is that economists who consider this factor agree that the denominator is getting bigger, but it only explains part of the gap.
Some measures claim to adjust for household size. See this article in The Economist on wage stagnation, for example:
https://www.economist.com/finance-and-economics/2018/03/31/the-average-american-is-much-better-off-now-than-four-decades-ago
Only skimmed the comments on the multifactorial trend post, but I did not see anyone mention the bias in your selection of social trends. Lots of things are affected by lots of things, and over any given period there are a million different things that can change about society. If you pick one that you already know has changed, there is no “coincidence” in a bunch of things affecting it overlapping to change it. You’ve purposefully chosen a social fact affected by lots of things that you know has changed over time. The fun then is to find out a bunch of things that effected the change and their relative importance. And look!–you did it.
While you dismiss it as staying basically the same, the reduction in labor share of income is actually a much more surprising and much more significant factor than you give it credit for.
From the site that I assume your graph came from (https://www.bls.gov/opub/mlr/2017/article/estimating-the-us-labor-share.htm), economists for a long time thought that labor share of income was magically stable at around two-thirds. But recent decades have shown that to be false – “in the early 21st century it fell to unprecedented lows.” Falling from 63% to 57% is a huge amount of money in the national economy, and about a 10% reduction in the slice of the pie available to workers.
However, this aligns pretty well with your final conclusion that this causes maybe 15% of the problem. I just disagree with your assessment that it’s not a big issue in the first place.
I don’t whether the magnitude and the time trend would back it up, but one possible explanation for the drop in labour share might be the rising pension fund holdings. If I understand the BLS statement you linked correctly, then Labour income only includes the direct contributions to these funds, but not their returns. This might especially work if firms were banking on stock market returns to fulfill pension obligations and consequently reduced direct contributions. As pension fund returns are some form of deferred compensation, this might make direct labour share lower in comparison to total output share that is ultimately received in compensation.
I recall seeing some analysis showing that the the rise in capital’s share of national income was almost entirely due to increased housing costs. Since the median worker owns their own home I wonder if adding the imputed rent from the CPI to their income would change measured inequality.
Maybe, but I don’t think that adjustment would be of value.
If the price of housing rises, everyone becomes poorer when they buy a house (relative to the counterfactual lower price of housing). Their imputed rent is higher, but this doesn’t improve their material situation in any way — they’d be getting exactly the same housing services, at a lower cost, in the counterfactual world where they’d bought the same house at a lower price.
Then adding imputed rent to their income will give you a higher “income” number that magically doesn’t reflect any additional benefits to the “income” earner. You only benefit from higher rents if you actually rent out your home, but that’s already included in non-imputed rent income.
So if you’re trying to see how well off the workers of today are, attributing imputed rents to them is actively misleading. It will raise your estimate of their well-being despite not improving that well-being. If you’re trying to investigate “where is the money going”, the adjustment would make more sense. It’s the same distinction Larry Summers drew between “consumers’ experienced rise in living standards” and “the real cost to firms of emplying workers”.
On the flip side, if you want to make comparisons between labor and capital income (as scott does later on), it’s unfair to ignore the rise in owner-equivalent rent or cap gains from housing sales.
Section 5 of this post, about labor vs capital income, makes absolutely no mention of homeowners. It mentions Bezos and Zuckerberg, and hints that small business owners are also included. But as Matthew Rognlie showed, the bulk of Piketty’s rise in capital vs labor income is due to middle class homeowners.
Specifically, suppose capital income is increasing due to homeownership and NIMBYs driving up the price of housing. There’s no reason for this to drive median wages up – if anything, keeping low skill workers from migrating to SF will drive median wages down.
Furthermore, the prime mover of this effect isn’t Jeff Bezos or Martin Shkreli. The prime mover looks a lot more like AOC or a middle class soccer mom from Long Island. The prime policy levers to pull here are not unionization or taxing the rich, but deregulation of housing/zoning in predominantly blue areas.
Capital income from housing and NIMBYism vs capital income from businesses and cronyism changes everything pretty dramatically.
I’m not sure what your model here is, but I think the opposite is true. Low-skilled workers earn low wages. Keeping low-skilled people out will necessarily drive median wages up by chopping off a chunk of the low end of the wage spectrum.
I can see this argument as to housing sales, but I don’t see where owner-equivalent rent figures into it. You’re not actually earning any extra money when your imputed rent rises. What comparison are you drawing that shows labor being better off as a result of increasing owner-equivalent rent?
Ah, good point.
@Michael Watts
Keeping low skilled people out of SF may drive up median wages in SF, but nationally it lowers them. People who would otherwise be able to earn more by moving to SF are kept out.
I didn’t say labor was better off as a result of increasing owner-equivalent rent [1]. I said a discussion of capital vs labor income that brings up Bezos and Zuckerberg, but not middle class NIMBY soccer moms and AOC, is describing the issue incorrectly.
[1] However, I will make the argument that *homeowners* – who may or may not be workers – are better off. They gain access to a high value good – living in a high wage, highly desirable area.
Scott can you clarify your thought experiment on redistributing executive salary:
It seems like you’re just talking about the base salaries of top Apple employees? For the top people, most of their pay will be in the form of restricted stock units (RSUs). If we include RSUs, $500,000 seems like a lowball estimate for the top 1% of Apple employees. Tim Cook made $136 million in 2018 when including stock, and top paid engineers often make over $1 million a year when including stock.
Or would RSUs be counted as part of the “capital” share of GDP? Since typically RSUs are counted as income when filing taxes, they should be included as wages, no? If it is, redistributing wages from top executives and engineers could actually make a huge difference to lower level employees, at say, the Apple store.
That’s a good question, and maybe it’s why I can’t make the numbers add up.
To give more context here, for folks working for FAANG companies with total comp in the $100k-$1m range, we tend to treat stock, bonus, and salary interchangeably, and lump them all into “total comp”. You can find breakdowns at e.g. https://www.levels.fyi/SE/Apple/Google/Facebook . At least at Google, it’s common wisdom that you should be auto-selling your stock as it vests, then reinvesting it into an index fund, to diversify away from investment in Google (which you are already highly leveraged on by virtue of them providing you employment). So, I think at least for folks in that range, we treat stock not as capital, but as wages.
For CEOs or other high-level execs, this is probably a bit different, as they seem to actually keep most of their company stock, only selling it when they want to buy a football team or whatever. I’m not sure how to factor that in.
So given this, I’m not sure how it impacts
but I am pretty clear that the answer to
is that it definitely takes money out of the total comp budget, which is treated equivalently to salary by some (large?) portion of workers.
Stock based compensation should certainly be counted as income, not returns to capital. In fact, share based compensation is taken *directly* from shareholders, in that the new shares are created out of the vacuum, instantaneously diluting existing shareholders.
It is true that the most highly compensated people in a company must, by law, jump through a bunch of hoops before selling stock (some are required to hold lots of stock while employed, many more are required to plan their sales months-to-years in advance), but this doesn’t change that they’re receiving labor income.
For Apple specifically, total stock based compensation in the last calendar (not fiscal) quarter of 2018 was $1.5 billion (see the 10-Q, go to financial statements, see condensed consolidated statement of cash flows), so it would be reasonable to estimate this as $6 billion annually [edit: I just looked at the 10-K which annualized everything, the total was $5.3 billion for fiscal 2018, so feel free to reduce all these numbers by 15%].
Stock based compensation as a major factor in total compensation will be true at least for senior engineers and management, but it’s not even vaguely evenly distributed; my guess is the top 1000 people at Apple earn 80-90% of that money.
All in all, stock based compensation for Apple’s top 1000 employees is likely around $5 billion/year. Redistributing just that income to all 100,000 employees would increase everyone else’s compensation by $50,000/year (without even having to take money away from the already extremely well paid engineers!).
I was paid in part through stock options, and I paid taxes on all the realized income, and it went into all the various income statistics.
Personally, I would like to recommend that we don’t take away the incentives for the entrepreneurs who created so much value for humanity. If we must redistribute, let’s take from pro athletes. All they do is throw balls around for our entertainment. The top pro athletes make substantially more than the top CEOs.
I would much rather live in a world without Lebrons than without Bezos’s.
Just saying.
I’m a huge sports fan, and am also frequently annoyed by the massive salaries for pro athletes, but the reason they aren’t a good target is that they are a drop in the bucket. They’re just more visible.
I don’t think anyone (in this comment thread, at least) is suggesting going after entrepreneurs.
Describing the extent that stock based compensation for executives vs. rank-and-file employees at established public companies skews the income distribution doesn’t seem obviously connected to whether entrepreneurs can earn outsized returns as they grow small companies to larger ones.
Perhaps you’re inferring a “and we should use tax policy to discourage this maldistribution” in my description? As it happens I do think we made a mistake when we lowered top income tax brackets for executives, because we didn’t know that the cure for gold-plated-bathrooms-as-in-kind-benefits-for-CEOs was going to be worse for society than the disease.
But changing subjects completely to athletes, major league players come about as close as I can imagine to receiving purely talent based compensation. If anything, the most talented NBA players are undercompensated, because the players union sets max contract caps that are well below their expected utility to a given team.
But I do imagine if we brought back higher income tax brackets, pro athletes would be heavily affected.
I am sure I saw a comparison a few months ago which revealed the top 500 athletes make more —all in — than the top 500 CEOs.
If we are extending the population to all executives of corporations, then we are implying that these people — who clearly are responsible for a significant part of the operation of our economy — should not be incentivized for excellence. Seems like a great way to shoot ourselves in the foot while feeding our envy.
@Swami
It’s probably a mistake in that comparison to look only at the top 500 CEOs. Look at the top 500 business officers, period.
Easy to find a replacement for a top 500 CEO. Not so much for a top 500 athlete.
I was under the impression this was a legal fiction, but I confess I’m not intimately familiar with Microsoft’s structuring.
Many companies (including Apple) simultaneously issue new shares from thin air, AND institute stock purchase plans that have the effect of reducing dilution.
But if Microsoft structures these as being legally, as opposed to metaphysically, connected, I can’t really argue with that.
Stock shares are also the primary source of income for the winners of the venture capital startup game. As a non-founder, you get paid poor wages, freedom, experience, and stock. VC startups are explicitly about disruptive business models, concentrating outsized productivity and compensation to a much smaller group than competing prior models.
They cause winner-take-all effects (which would help decouple productivity from average compensation) several ways:
1) Stock in a startup is only really valuable when it “exits”: goes public or gets bought. As many as 2/3 of funded startups never do so. Startup employees accept this risk, because the potential rewards are outsized.
2) Most startup positions require some highly skilled work. They also have a structural bias toward people who can afford to delay compensation. Both of those select for privileged classes of employee, which shows in most startup rosters.
3) Of the startups that exit, most are modest purchases. Only roughly 1% of funded companies become what are called “unicorns”: companies that grow exponentially, returning hundredfold or more what was invested, and paying for all the other investments.
4) Incumbents in disrupted industries — think taxicabs, post-Uber — are going to experience a productivity and wage slump. The disruptors are generally hiring from the same employment market, however, so they don’t have to offer larger wages to the rank-and-file employees. I don’t have easy evidence, but I imagine the Uber drivers make the same or less than traditional cabbies.
Founders and early tech employees of former unicorns are today’s new multi-millionaires, but their compensation is heavily balanced in these averages by all the failures, whose employees only earn substandard wages and experience, and whose founders made even less.
That’s probably having an effect on these graphs, and I don’t know how you would tease it out from the rest. I do know that this trend really got going around 1972 (in Menlo Park, CA). My suspicion is that a combination of this and the confusion caused by the collapse of Bretton Woods and the growth of the Internet has allowed a small group of people to start making outsized gains. Partially, they accomplished this by carefully not degrading average quality of life in the rank and file; things didn’t get better, but they also didn’t get much worse, so nobody complained too much.
Just want to second that I think this is a really big deal and probably throws things in this section way off.
Just a general warning to casual readers. Beware the zero sum fallacy.
It is easy to make the incorrect assumption that those at the higher income gained at the expense of those at the lower end. This is a terrible assumption in a non zero sum economy. It is very likely that – especially when dealing with complementary skills or resources such as management, capital, entrepreneurial risk and labor, that more going to the former leads to more rather than less for labor than would otherwise have occurred.
IOW, median wages went up 40 to 65% (depending on inflation adjustment and other factors) but there is a very real possibility that with global competitive pressure, the incomes would have increased less or even been stagnant or dropped without the entrepreneurial talents of those who were rewarded for creating Wal-Mart, Apple, Microsoft, Uber and the other dozen or so new tech upstarts of the past thirty years.
This is really difficult for most people to grok, but is essential for understanding positive sum systems.
Important to remember that there are two[ish] things being discussed:
1) Are people worse off than they were x years ago?
Scott seems to have found enough information to convince them that they are not, although of course that isn’t quite enough to say the matter is settled. This is the point that your post addresses.
2) Is there increasing inequality in how economic gains are distributed?
2a) If yes, why?
2aa) Is that a problem? Why?
2aaa) If yes, what do we do about it?
Some people do not accept that people are really better off, so are concerned about both 1 and 2. Accepting that people are better off (and therefore being able to dismiss 1) does not necessarily preclude concerns about item 2 though.
Well said, acemetric,
Yes, to give my feedback to answer your points…
1. Incomes are up 45-60% when adjusted for benefits, inflation, transfers and taxes, but excluding the effects of immigration (which would increase it slightly more). Considering the US started with the highest Average Individual Consumption of any large country, and ended in the same place, this is a good thing, however the rate of increase was lower in the US (and all developed countries) compared to prior eras. The rate of increasing incomes was higher globally.
2 and 2a. Income inequality within developed nations is up slightly, by a few points, due to an assortment of reasons, including changes in marriage rates. Do note that this figure is annual snapshot inequality, which blurs away the massive changes in income over people’s life cycle (two out of three households make it into the top tier at some point in life). Honestly I am unaware of any studies of lifetime Gini.
2aa. This is not a problem, it is simply a numerical relationship. People tend to do a mental shortcut of assuming inequality of result is some type of measure of unfairness. Not the same thing. There is no intrinsic state within economics of higher inequality being more or less unfair, all else equal, than less inequality. Unequal in no way proves or even implies unfairness. Indeed, I would argue that changes in labor share is reflecting the market telling us (informing and incentivizing) that we need more entrepreneurial activity and investment to capitalize on the surplus of labor created by 1.5 billion Chinese, Indian and SE Asain workers entering the global economy in a single generation.
2aaa. What we should do is listen to the market signals and incentives and encourage entrepreneurial activity to create the new industries and tech and ventures necessary to capitalize on the largest increase in globalization ever. This will continue the recent trend of substantially higher incomes globally (and unlike developed nations, the developing nations are seeing unprecedented gains in median income). This is the greatest improvement in human welfare in history, and we must be careful to avoid derailing it when it is working so well.
In short, changes in rewards are signaling entrepreneurial opportunities, and we must avoid disregarding the signals, because we are not happy with their side effects (slightly lower growth rate in annual median incomes within developed states for a generation)
These are my thoughts, but I would be interested in hearing others….
There’s also:
3) Are people (significantly) worse off than they could have been with a different set of economic policies?
That is the real question. And to many people, the answer to it seems to be “yes”, and the reason for it seems to be related to inequality.
Eric,
Seems like this was covered in question 2aa.
I am sure that there is some alternative universe where a combination of factors and policies would lead to better welfare in developed and developing nations. This is true even though the last thirty years has seen the largest gains in global welfare in the history of mankind. IOW, even though historians will write of it as the greatest surge in well being ever, it probably could have been even better.
I certainly can see how any policy which opposes rent and privilege seeking or exploitation and theft would likely lead to even higher welfare gains. Not sure if this leads to more or less inequality of outcome, and frankly I think a focus on equality of outcome on an annual basis is a distraction.
As I said elsewhere, inequality of income on an annual basis is a terrible proxy for fairness of a system. Fairness is a substantially more complex term and includes fairness of rules (rule egalitarianism), proportionality of rewards to contribution (just rewards), and equality of outcome regardless of contribution (such as measured by Gini).
I think a strong case can be made that the reason wages continued to grow as fast as they did in the US compared to most other developed nations (which benefit from drafting via catch up growth on the leader) is that entrepreneurs were incentivized to create the massive technology companies of the last 30 years. The tech giants pretty much all came out of the US (Apple, Google, Microsoft, Uber, Amazon, Walmart, etc) and embarrassingly few came from Europe or Japan.
The world would be a substantially poorer place for consumers, workers and investors without these game changers. And they came out of the country with largest rewards for entrepreneurial activity, and they contributed to inequality of outcome within the nation (but reducing it globally).
Do you mean they think they would be better off with other policies for inequality-related reasons, or that they would actually be better off in your opinion?
I had the same thought, and would add that even after RSU compensation you still need to account for people holding company stock (which applies to a much wider array of companies than just RSU-heavy tech companies). Tim Cook seems to have something more than 5M shares of AAPL, which means he makes about as much as his salary every time the stock increases 1%.
I would think that the right way to model people like him is just to treat him as part of the company, rather than as a very highly paid “laborer”.
So this is really capital vs labor inequality, more so than wage inequality, after all?
Perhaps we might say that capital/labor and wage inequality aren’t actually well defined, so that someone being paid in stock sort of violates the simplistic model in which they’re entirely separate.
I don’t think payment in stock should be considered a problem for calculating things. When the stocks are transferred from the company to the employee, the value of the stocks is salary (at least it should be counted as such). When the employee makes a profit on that stock, that’s capital income (just like if the employee had invested some of his cash salary in stocks). Of course many people are both laborers and capital owners, but what income is labor income and what is capital income can be defined.
Er, that’s not quite what I had in mind. But let me spell this out since I’ve been pondering it all day.
The question at hand here is, are wages stagnating compared to growth? And in section 4, Scott explores the idea that part of the effect is that people and businesses value different things, which might increase in value at different rates. If I waved a magic wand that made food cheaper, that would increase GDP for everyone, humans and businesses alike, but it would tip towards the “wages” side of the “wages vs growth” scale, since food is a much bigger expense for the average person than the average business. And if I magically made warehouse automation better, same thing in reverse – it’s good for everyone, but it’s more good for businesses (who spend a lot of money directly on that) than for people (who spend a little bit indirectly on it when they purchase products).
So what I’m saying is, for an exec like Tim Cook, so much of his income is tightly coupled to Apple’s income that he is more like the average business than the average person. He will never even notice the make-food-cheaper wand, but the make-warehouse-automation-cheaper wand could make him feel much richer. So it seems misleading to include him in discussions of “wage-earners”.
Is my brain out to lunch, or are you an order of magnitude off here? 1000 people multiplied by $0.5M each totals $0.5B, not $5B.
Scott’s math was wrong by an order of magnitude, but amusingly his estimate of compensation for the top 1000 at Apple was off by greater than an order of magnitude, so I think his estimate of $5 billion was in the right ballpark, judging from the share-based-compensation section of Apple’s 10-K.
Are you aware of Scott Winship’s analysis ([1])?
He combines a few points you mentioned (different inflation measures used for productivity vs. wages, accounting for non-wage benefits). But he also points out that the productivity measure looks at one group and the wage measure looks at a different group (a subset if I recall). Maybe that relates to your inequality category.
With those factors accounted and a few more he lists, productivity and compensation seem to track fairly closely.
[1] https://www.forbes.com/sites/scottwinship/2014/10/20/has-inequality-driven-a-wedge-between-productivity-and-compensation-growth/
Most of Winship’s points are the same as those I bring up, but there’s one place I think he goes too far.
His Rule 3 essentially rules out caring about wage inequality by fiat. That is, if one guy gets all of the money, the mean will stay the same (while the median obviously goes down). But when people deploy The Chart, they’re usually trying to make some argument about inequality.
It’s correct to use the mean if you’re trying to prove some kind of economic theorem about how much money goes to labor. But if you’re trying to make a real-world point about inequality and ordinary people not doing as well, it’s correct to use the median. I think his point about supervisory workers is similar – they should be included in order to measure abstruse economic factors, but “everyone except the boss is earning less” is a perfectly reasonable theorem to consider.
If you do things his way, then you do get pay neatly matching productivity, as I mentioned above (at least up until 2000, when labor-vs-capital inequality starts to matter more, which I think his graph shows). But as I argued above, if you stick to looking at the median, then factors like compensation and inflation and so on can only explain away about half of the problem.
One of the papers I looked at looked into self-employment etc and found it had a pretty miniscule effect. I probably should have included it for completeness, but I don’t think it matters too much.
I’m pretty sure the graph I use isn’t family or household-based, and more sure that individual graphs don’t look much different.
Isn’t Winship’s rule 3 more about the underlying mechanism?
If I understand him correctly, he says that the individual productivity of the median worker is not necessarily tracking the aggregate productivity used to demonstrate the point of decoupling. Consequently, if the intention is to explain decoupling with overall statistics, you need to use the mean as an aggregate statistic. If you want to show decoupling with median income, then you need to also use median productivity (and that can’t be inferred from the aggregate productivity number).
You are probably right to use median if you want to talk about the experience of ‘ordinary workers’, but using median income data you cannot identify whether decoupling happened as a systematic effect for the whole economy and you cannot distinguish for the median worker whether the gap is due to decoupling or due to differential productivity development.
To summarize, individual compensation went up in proportion to individual productivity. Median productivity stagnated, and wages stagnated correspondingly.
I.e. there’s no decoupling of wages from productivity, there’s decoupling of median worker productivity from top worker productivity.
Further data in support of this is contained in the paper Capitalists in the 21’st Century. This paper shows that a disproportionate number of rich people are owner/operators of businesses they created, and that their individual human capital is the driving force behind the business. (It demonstrates the latter by measuring a precipitous decline in business value after the untimely death of said capitalists.)
And this is why closely held businesses should be sold to someone(s)* who is skilled at the business, not remain in the hands of those who are merely heirs. (* – This may actually be the rest of the employees of said business, or particular employees, at least.)
We do not know to what extent the decline in business value is a result of gross incompetence/uncaring by the heirs who undercut the knowledgeable employees (i.e. destroy the labor-wealth of those employees by driving them away or hamstringing them) versus loss of the originating ‘genius’.
Also don’t overlook the importance of actual capital versus human capital. Money is needed to run a business, and if that money suddenly is split between a bunch of heirs, there might not be enough left to run the business.
——
Your linked article also is probably evaluating “capital” instead of “productivity” in the businesses it surveys. This is far easier to do (income – expenses = capital growth), but the actual products delivered by the businesses should probably be evaluated based on their CPI value, not necessarily what the business happens to charge.
For businesses such as repair shops ideally they’d be based on the current CPI of the original value of the replacements, since I know the hard way that autobody shops, for instance, charge a great deal more for paint jobs than the original painting of the car in the factory. They do this because it’s a bespoke service, but that inefficiency of scale is a loss of productivity, not a gain.
(These are all thoughts and assumptions of mine, and can be argued against. I have no special knowledge.)
Where can I find data on median productivity?
Not a labour economist, but my guess is that we currently don’t have a good idea how to calculate that. Usually, we would take income as a proxy for productivity (wage = marginal contribution), but the whole discussion here is whether that is still a good approximation.
I’d expect that it to be difficult to produce statistics on the producivity of different people. A company needs capital and different kinds of employees. How do you decide how much of the producivity of the company you assign to each employee, and perhaps to capital? (Conventional mean labor producivity doesn’t asssign any to capital.)
I agree. Winship’s article explains (or more appropriately, explains away) the supposed dilemma pretty thoroughly and concisely. I recommend everyone read Winship as an appendix to this excellent analysis.
BTW, the median income is also affected by the large increase in percent immigrant, which was at a low at start of 70s and is at a modern era high in current decade. I’ve heard this artificially depresses median income by around another 3% or so if memory serves.