
The International Journal of Obesity (h/t amaranththallium) points out a correspondence between US topography and US obesity rates:
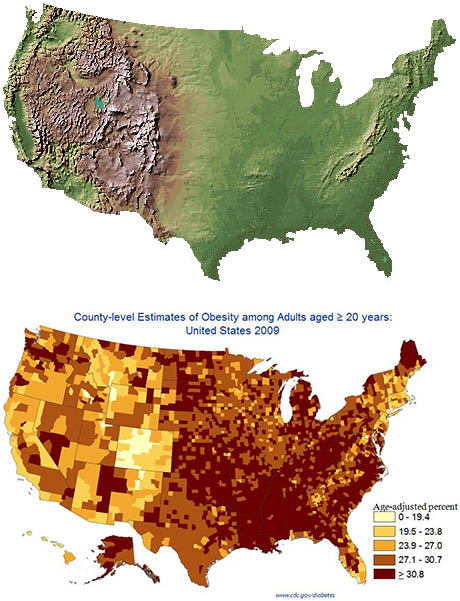
It’s easy to see the Rocky Mountains on the obesity map. Not too hard to see the Appalachians either. Squint a little and you can even see California’s Central Valley vs. its coastal ranges.
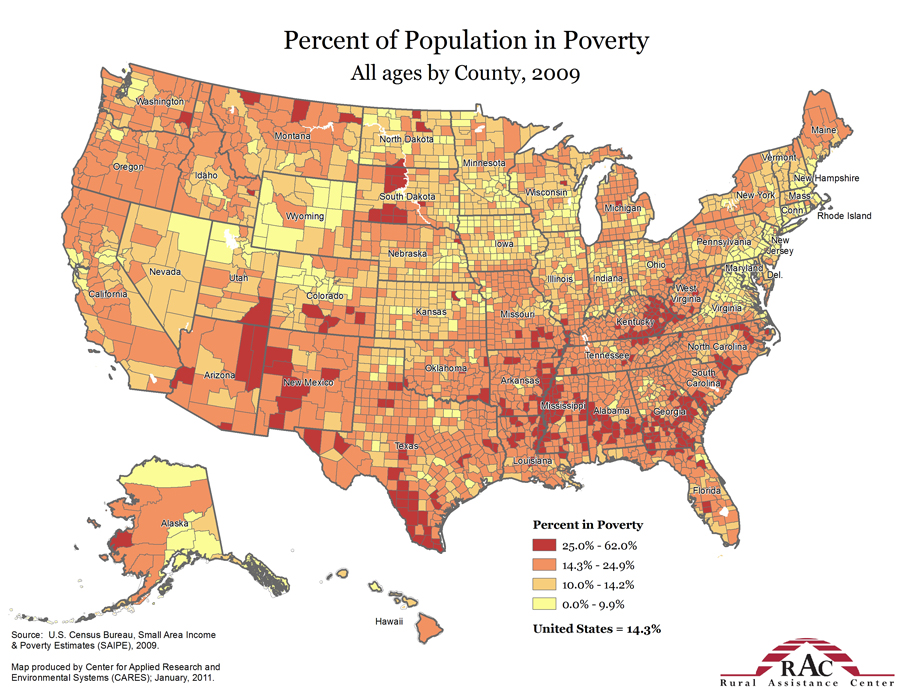
This doesn’t seem to be related to poverty or population density. It does look a lot like the map of exercise level, but apparently it stays significant even when you control for that.
The IJO study finds that people living at sea level are five times more likely to be obese than people living at 500m elevation, even after controlling for “temperature, diet, physical activity, smoking, and demographic factors”. I don’t always trust controlling for things, but in this case the effect is big enough, and similar enough to the results of eyeballing, that it seems pretty plausible. Also, European studies find the same effect in high-altitude areas there, as do studies in Tibet. And someone did a study on US soldiers, who are randomly assigned (via deployment) to different areas, and found the same effect controlling for BMI at enlistment.
(on the other hand, a study in Saudi Arabia finds the opposite. Whatever. I didn’t even know Saudi Arabia had mountains.)
So what’s going on? There’s a well-known phenomenon called altitude anorexia where lowland people going to a high altitude suddenly can lose a lot of weight. Unfortunately most of the studies just stop at showing an acute effect; it’s not clear how long it lasts or whether there are more general principles involved. One study on rats found that they ate 58% less one day after being transported to Pike’s Peak, and were still eating 16% less per day two weeks afterwards. An article in High Altitude Medicine noted without further details that altitude anorexia seemed to persist after initial acclimatization. Pugh et al note weight loss of 1 kg/week up to 5-10 kg over a several week Everest ascent, reversing quickly as the climbers descended. A controlled experiment where obese subjects were ferried to the Swiss Alps, told to eat as much as they want, and banned from exercising resulted in weight loss of three pounds after a week, mostly sustained (?!) after a month at low altitude. It seemed mediated by eating less, which was independent of altitude sickness and persisted after people were no longer altitude-sick.
The active ingredient of altitude seems to be hypoxia. The air is thin at high altitudes so the body gets less oxygen. Being in low oxygen conditions in normal pressure seems to cause weight loss too – see here and here for studies of people exercising in low oxygen conditions. I don’t know of any studies where people were just kept in low-oxygen environments for a long time without exercise to see what happened to their weight. It’s not really clear how reduced oxygen makes people eat less. A lot of people mention leptin, but the studies seem pretty unconvincing, and people try to work leptin into everything.
This BMJ editorial suggests that hypoxia should get credit for smoking-related weight loss. But it reads like a completely unhinged screed from the tobacco lobby of an alternate dimension (“Might the aggressive anti-smoking lobby have contributed to the costly epidemic in obesity and type 2 diabetes that Professor Sir George Alberti have warned us about?”) so maybe we shouldn’t take it too seriously. Also, nicotine gum works just as well as cigarettes here, so it’s probably an effect of the nicotine itself, and in fact we have some pretty good ideas how this happens. Maybe unhinged screeds by alternate-universe tobacco lobbies aren’t the most trustworthy source of information.
Anyway, this is boring. Let’s move on to a more interesting question – did global warming cause the obesity epidemic?
The arguments in favor: there’s a lot more carbon dioxide in the air now than there was just a few decades ago. The obesity epidemic began around the time carbon dioxide concentrations really started getting worrying. And there are various body functions that are exquisitely dependent on CO2 levels. Bierworth (2014) has a good run-down of some of these and how they might be affected by increasing atmospheric CO2 levels (dear conservatives who always talk about Chesterton’s Fence and principle of precaution – has it occurred to you that doubling the concentration of a major bioactive atmospheric gas might be a bad thing?). I see some conflicting claims about how much atmospheric CO2 could affect average blood pH. Neurons that produce obesity-regulating chemical orexin are potentially very sensitive to blood pH, so maybe this could be involved?
Wild animals are affected by the obesity epidemic too, even though they eat far fewer Big Macs. Even lab rats and zoo animals, supposedly kept on a well-monitored diet, are heavier now than they were decades ago. It’s hard to think of some obesogenic factor so prevalent that it could seep into laboratories and zoos unnoticed by scientists and zookeepers. If it were a chemical, it would have to be really prevalent. The xenoestrogens in the water are one possiblity. But the other is the atmospheric gas breathed in by every living thing which we already know has been increasing for decades.
This at least is the theory of epidemiologist Lars George Hersoug. He did a study where he put some people in a high-CO2 room and found that they gained weight. It got a decent amount of press.
I really like this theory. It’s elegant. It’s clever. It’s at exactly the right level of contrarianism to be fun. If it were true, it would solve global climate change – once tabloids covers trumpet THE ONE SECRET TO A TIGHT BELLY DOCTORS DON’T WANT YOU TO KNOW – TELL YOUR CONGRESSMAN TO PASS THE PARIS AGREEMENT TO LIMIT CLIMATE CHANGE TO WITHIN 2 DEGREES CENTIGRADE OF PRE-INDUSTRIAL LEVELS, we will finally get Middle America on board. Insofar as scientific theories can be “fun”, this theory is fun.
But I grudgingly acknowledge that it’s probably not true.
For one thing, the study involved kind of sucks. It has a sample size of six. The six people were in a chamber that elevated CO2 levels about 50x higher than human industrial activity has elevated them in the atmosphere. And it got a non-significant result. In fact, food intake decreased in three of the six subjects, with almost all of the (nonsignificant) positive trend coming from one guy who apparently was just really hungry that day. There is a decent study showing CO2-related orexin effects in mice, but it’s at 2000x atmospheric concentrations. Also, when I look at the orexin neuron calculations, even if their hypothesis is true it suggests that orexin neurons might fire a little less than 1% more often now than they did 100 years ago. Unless there’s something really nonlinear going on, this is not enough to cause an epidemic.
For another, it doesn’t seem to line up geographically. Zheutlin, Adar, and Park try to correlate the geography of US obesity with the geography of US atmospheric CO2 in the same way that some of the studies above successfully correlated US obesity with US altitude. Here they fail. After adjusting for appropriate confounders, there is no clear relationship between CO2 levels and obesity. I think this might also reflect a more general point, which is that CO2 has been rising all over the world but obesity hasn’t; Japan, for example, is a very high CO2 emitter but has almost totally avoided a US-level obesity crisis.
(but while we’re talking about this study, it did find that serum bicarbonate has been increasing over the past decade or two. No proof as yet that this is a real effect or related to CO2, but have I mentioned that increasing the concentration of a bioactive atmospheric gas worldwide is a really bad idea?)
One last counterargument. A global warming skepticism blog points out that submarines are a natural laboratory for the effect of high CO2 on human health, since they usually have CO2 levels up to ten times atmospheric (and several times worse than even a poorly-ventilated building). I don’t see any formal tests of their own argument, which is that submariners don’t suffer any cognitive problems, and I’m not sure they’re right to use intuition and failure to notice gross impairment – after all, the original studies showing impairment were done in office buildings, and there’s no grossly noticeable differences there. But in any case, the Navy actually did a formal study and found that submariners do not gain weight. This seems pretty fatal for a CO2 = weight gain theory.
So my guess is that Hersoug is wrong and CO2 doesn’t cause appreciable weight gain in normal concentrations. We should abandon the beautiful theory of climate-change-induced obesity and go down a level of contrarianism to blaming boring normal-person things like xenoestrogens and gut microbiota.
(I’ve heard there are theories of obesity even less contrarian than those, but I’ve never been to such low contaranianism levels and wouldn’t be able to tell you what they might be.)


I can’t find any papers on submariners either, but NASA was apparently intrigued enough by the office CO2 papers to temporarily tighten their maximum allowable CO2 concentration for astronaut crews pending a more detailed study (or did in 2013; I can’t find a follow-up).
EDIT: Accidentally pasted wrong link, fixed.
On submarines, I did find this abstract suggesting no cognitive impairment during patrols, but no access to full text
https://www.researchgate.net/publication/235093180_Motor_and_Cognitive_Performance_Do_Not_Change_during_a_Ten-Week_Submarine_Patrol
How long do submariners spend onboard? I don’t know, but it’s much less than a lifetime.
Typical for an attack sub is 3 months but boomers have been known to do up to a year at a stretch.
Not exactly. The standard boomer patrol is 90 days. What makes boomers unusual is that they have two crews, and the boat itself can thus spend more time at sea. The crews don’t, although they do spend very nearly half of their time at sea, usually in ~3 month increments.
My immediate thought on an altitude-obesity relation was to wonder if it’s related at all to the altitude-suicide relation. But I suspect that if going to higher altitudes had such rapid depression-inducing effects that would account for the weight loss, we would have noticed already…
CO2 is interesting but the studies aren’t very consistent. The dose range is huge which should make harm obvious if the effect from that office study was remotely correct. I looked into it earlier somewhat: http://lesswrong.com/lw/nk0/what_is_up_with_carbon_dioxide_and_cognition_an/ https://www.gwern.net/zeo/CO2
Actually, as far as altitude goes, I think there’s a more interesting connection to mental illness. Altitude pops up in some of the lithium drinking water papers (https://www.gwern.net/Lithium), and is connected with suicide/ADHD: https://www.eurekalert.org/pub_releases/2011-01/mali-srg011311.php https://mic.com/articles/104096/there-s-a-suicide-epidemic-in-utah-and-one-neuroscientist-thinks-he-knows-why
At a quick glance, the mountains show up but the high plains don’t. I think this argues against an altitude effect, though I think it would be premature to suggest a “flatness” effect (e.g. people who live in the mountains tend to spend more energy walking). And the Appalacians have other confounders, like the people living there being dirt poor and doing a lot of meth.
Florida is a pretty good counterexample to both-not very far but extremely flat and low altitude.
Also, I wouldn’t take any of the plateau data too seriously. You see the large county sizes and high variability? Almost no one lives West of the Rockies until you get to California.
Quite plausible. I started to get in pretty good shape after moving to a very hilly city (at about the same altitude as my old home). If you walk around there just doing the daily shopping, you don’t need any more exercise on top of that.
If CO2-caused weight gain is mediated by eating more and dietary choices on submarines are restricted, maybe not. We have a former submariner or two in the ‘sphere, dunno if any of them are on SSC though.
Hey that’s me! Anecdotally, I experienced weight gain due to more frequent meals/less exercise/less sleep when out on patrol. The conventional wisdom on my boat was that you get fat and out of shape while on patrol and have to work to get back in shape when you return to shore. There was even a term of endearment for the little bit of extra people would get around their midsections, we called it your “boat coat.”
That being said, I haven’t done any research whatsoever into any real studies on the matter.
My brother is a submariner. He goes out for six months at a shot, and yeah, he’s usually a bit tubbier when he gets back. My dad (who was on submarines himself back in the day) berates him for it, but it seems to be something that’s common. Food on subs is famously extra good (to make up for having to be down there, I guess) and it’s hard to work out in a tiny shipboard gym. On the other hand, I wonder if they accounted for the fact that sailors have fitness standards to abide by so if they notice they’re gaining weight, they’ll consciously try to eat less/exercise more to account for it. They can lose their job if they get too heavy.
Just going to point out that even if CO2 caused weight gain, it would not be caused directly by global warming, but rather the two would share the same cause.
Or maybe you were making a reference to runaway global warming that liberates greenhouse gases previously trapped in the permafrost?
I suspect the factor being picked up as altitude in the map is actually just pleasantness of going outside and walking about. The rocky mountains being captured are relatively southern, not to cold in the winter in the valleys and scenic high altitudes which would be fun to do active stuff since its sunny and won’t be to hot in the summer.
Compare that to the southeast where its muggy half the year and there’s nothing to see or Alaska where its to cold most of the year to be active outside and the big winter sport is riding a motorized sled.
Just eye balling it the map is a pretty good heat map of “places id like to take a walk”.
Sure, that’s probably what you see in the map. But Scott mentions that the effect persists after controlling for exercise.
At any given level of exercise, skinny people might be more predisposed than the obese to wanting to live in environments where you can walk/hike/enjoy the outdoors. Migration patterns by body type could then partially explain the map.
I suspect there’s alot of activity that wouldn’t be captured by exercise but is none the less outdoors walking about stuff. Like i there are probably obese people in Alabama and skinny people skinny people in Colorado who technically have the same level of exercise but none the less have very different lifestyles.
Like it would be massively shocking, headlines everywhere if there wasn’t a lifestyle difference of some kind
Sounds like an excellent reason to support reforestation efforts, which will sequester carbon AND prevent erosion and other good things even if the carbon turns out to totally not be a problem.
It makes sense to want to be careful before dicking with *anything* potentially important if you have reason to believe you are closer to a local optimum than the step size you think you’re taking, but man made fences are very different than a merely inconvenient natural barrier. It’s not “do not mess with it”, or even “do not mess with it until you understand how everything that interacts with it works”, it’s “do not mess with it until you understand why it was put there”. If there’s no optimization process which chose the CO2 levels, then it was not “put there” and it’s not a Chesterton’s fence.
I think this distinction is worth preserving.
There was (is) an extremely famous optimization process that determined how organisms interact with atmospheric CO2. Is there a big difference between tearing down a fence and changing the terrain around the fence?
Is the distinction you want to make about human intention?
There’s gotta be an epistemological fallacy of some kind here. “It’s not really a Chesterton’s Fence situation because CO2 concentrations were never a factor in our thinking in the first place!” Would add, the one place where overwrought justifications for maintaining the status quo are justified, it’s in the realm of environmentalism, where we really only know for sure that things were working satisfactorily under conditions we’ve witnessed in the past, and where the long tail risks of change are things like the extermination of all life on the planet, and the possible, unintentional upsides (general increases in crop yields, warmer winters, freed up Arctic shipping lanes, whatever) just aren’t worth rolling the dice on.
There might be reasons for avoiding change that don’t fit the Chesterton’s fence pattern. Chesterton’s argument, as I understand it, assumes that there is a reason the fence was put there, and until you know the reason you don’t know if it is safe to remove the fence.
The reason the current CO2 level is what it is has nothing to do with being good for us–it’s the equilibrium balance of processes that produce CO2 and processes that absorb it. Nobody put it there.
the extermination of all life on the planet
This is a good way to signal that you’re not to be taken seriously. Especially when you’re going on about climate change, which nobody with any actual grounding in the science would consider at all plausible.
> If there’s no optimization process which chose the CO2 levels, then it was not “put there” and it’s not a Chesterton’s fence.
Of course not. But there obviously was an optimization process whereby human biology was adapted to the environment.
Nor is that really what I see the meaning of Chesterton’s Fence. Take borders between nations. Borders between nations were not drawn up through an “optimization process”. Often, they’re accidents; the result of years of negotiation, war, and occasionally fiat on the part of annoyed superpowers. That doesn’t mean that Chesterton would have us tear down the borders of every nation and redraw them “optimally”.
Indeed, I would probably hazard to say that Chesterton’s Fence applies doubly for natural barriers. You might not see the point of all these smelly trees; until you cut them down and realize how much biodiversity they supported, and that soil erosion is now turning the land into a dust bowl. Maybe you don’t see the problem with bringing over some seeds or a pet, until the land is infested with invasive vines and animals that destabilize the ecosystem.
Applying Chesterton’s Fence that broadly gets you the precautionary principle and full-on paralysis.
Borders optimize tax revenue. This is an extension of Coase’s Theorem.
Nonetheless. If we’re discussing Europe’s former colonies, all bets are off.
edit: wrong link
Yes. Chesterton’s Fence is not “Don’t remove it under any circumstances ever”, it’s “I don’t see the point of this – Well, don’t remove it until you do, then you’ll know if it’s a good idea to remove it or not”.
And it’s not as if we just started pumping a bunch of CO2 in the atmosphere for no particular reason other than we felt like increasing CO2 concentrations.
It was a byproduct of another thing we wanted to do that had clear and obvious benefits.
I did not read that as Scott thinking that man driven environmental change is literally a case of Chesterton’s Fence.
I assume he mentions Chesterton’s Fence and the principle of precaution, because they both play into a common ethos of not messing with stuff you don’t understand. If you value the positions “do not mess with it until you understand why it was put there” and “the burden of proving that something is not harmful falls to those doing something” then a more general “don’t go messing with stuff you don’t understand” policy is probably rattling around somewhere in your brain.
If you’re a theist there won’t really be a distinction, will there? For even natural things, someone (someone omniscient, no less) will have chosen to put it there for a reason.
Yeah, but theist generally know the reason, so we could use it.
You’re looking at this backwards. The CO2 levels weren’t optimized for us. We were optimized for the CO2 levels.
We were also optimized against an environment with periodic famines. And against an environment with contagious diseases for which we had no cures. And against an environment with no heating or air conditioning. And …
If we were optimized against a given concentration of CO2, that’s an argument against changing the relevant features of our metabolism while holding the CO2 concentration fixed. It does not imply that the present level of CO2 is optimal for us, only that if the level changed (in either direction) we could gain by modifying our metabolism accordingly.
Consider the case of plants, for which CO2 concentration is much more important. They are optimized against current concentration, but increasing the concentration results in greater yield and less water requirement.
Were we? Evolution occurs much slower than natural CO2 change. Even during the last ice age, CO2 levels were much lower than they are now.
Evolution isn’t that slow. Tibetans evolved adaptations for very high altitudes more recently than the last ice age.
The Inca evolved adaptations since the last ice age. Tibetans took orders of magnitude longer and got a lot better results.
This is one of the only topics I’ve avoided writing about much because it makes me sound like a crank. But I still think that high CO2 might be causing low physiological pH which is partly behind the global spike in allergies, asthma, and uric acid-related ailments like gout, obesity aside. And you could have a change in gut microbiota or appetite that is moderated by CO2 (or physiological pH) which then influences obesity. Submariners with monitored diets and exercise don’t show the same effects, because they are under orders to eat now and work out now. But for people with more self-direction, people self-regulate to more exercise and less food. I noticed when we went to the Rockies last year, my two older kids were suddenly a lot more physically active at night, even after hiking around a lot of the day. But N=2 there.
I don’t think eyeballing is appropriate here. Eyeballing is probably just due to the correlation with exercise. It doesn’t tell you about what happens after you control for exercise.
Similarly, the additional studies, of Europe, Tibet, and soldiers aren’t very helpful unless those break the correlation between altitude and exercise. (Soldiers seems promising for this, since they are probably being forced to exercise regardless of how nice is the environment, but this study didn’t measure exercise. And quasi-randomization is nice.)
I haven’t read the studies, but wouldn’t another explanation be that mountainous terrain involves expending more energy per unit of time spent outside? You could control for time spent walking or running, but that wouldn’t show that a half-hour walk in San Francisco is a lot more strenuous than the equivalent in Kansas.
In addition to terrain differences, exercise is just more difficult at high altitude, even on flat terrain. If you need more breaths and a higher heart rate to perform an activity at altitude than at sea level, then you are expending more energy to do high-altitude exercise, even if only from the extra contractions of your heart and diaphragm. I’m not sure whether this effect is significant, but if it is, straightforward ways of controlling exercise, like putting high- and low-altitude groups through identical routines, or measuring the time spent with an elevated heart rate, would probably miss it.
The post does an abrupt U-turn in the middle. Is there supposed to be any connection between the two theories? Perhaps high altitude causes weight loss not from less oxygen, but less CO₂?
Same. I expected the post to end with some sort of Hegelian-synthesis.
Don’t leave us with a cliff-hanger, Scott! (… gasped Tom.)
I think the first part was just there to prime the reader to the idea that atmospheric conditions could effect our weight with non-controversial and relatively stronger research before jumping in with the much more controversial, and weaker research of the second part. The ‘U-turn’ felt intentional for comedic effect, I thought it was a cute and fun bit of writing personally.
I found it jarring because the first half of the post seemed like a Big Deal. Without diving into the credibility of the studies further than Scott did, a strong link between low-oxygen environments and obesity prevention is something that I hadn’t heard of before, that falls outside the wide range of existing lifestyle-diet-exercise-sociology obesity writing, and that suggests new avenues of wrapping our mind around a major health crisis. It even (if taken on its face) points toward the possibility of weight-loss treatment that a) isn’t solely comprised of telling people to eat less and exercise more b) doesn’t involve fecal transplants and c) is affordable for the majority of people.
I’m not clear why that part was supposed to be boring, even after applying the standard “discount any excitement over early scientific studies by 90%” rate. Kept waiting for Scott to return to it, which is why it didn’t work as priming for me. (If this is a well-known effect that I’m simply ignorant of, then consider this a vote for it to get more attention.)
First of course, see my page:
Obesity Facts – The Unz Review
On the connection between obesity and altitude, it’s worth remember that, with geographic variables especially, lots of things correlate with lots of other things. There is a causal relationship there somewhere usually, but not necessarily between the variables you’re looking at.
In this particular case, I doubt high altitude reduces obesity. Nobody bothered to check the obvious confounding variable: self-selection bias. People aren’t randomly distributed across the map. An extended twin-family study should be able to disentangle this. I will say the fact that the shared environment term is a flat zero in obesity makes it doubtful that local environment has much an effect (since children growing up together obviously share local environment).
poast physique
https://en.wikipedia.org/wiki/Piedmont_(United_States)
What looks like the southern Appalachians is a trick of the eye. The light color streaking from DC to Atlanta is the Piedmont area between the mountains and the coastal plains. The more economically dynamic cities of the region are there like Raleigh, Charlotte, or Atlanta. Mountainous areas of East Tennessee, East Kentucky and West Virginia are quite overweight in my personal experience and on this map. They are saddled with high rates of diabetes. In East Tennessee where I am from you would not expect to see anybody much jogging for instance outside of the suburban population in the two major cities.
A lot of maps of bad things like median income, income mobility, or diabetes show the same pattern in the southeast. There’s the black belt–former cotton growing areas with large rural black populations–and a less defined swath from the Cumberland mountains in Tennessee through eastern Kentucky, West Virginia, and Central Pennsylvania with white populations that are classic hillbilly. Areas that were really good for farming got a slave economy. Areas that were really bad for farming got no economy. Just a sparse backwater population that trickled in late. Both ended up poor and unhealthy. Maybe the Piedmont is just the medium between.
I wrote a very long blog post on US health outcomes recently and you may find the density map section, in particular, interesting. Most of these patterns survive controlling for income and show a pretty clear correlation with self-reported ancestry (especially % “Scots-Irish” and “American”). Furthermore, it’s not just isolated to what most people think of as Appalachia or even the extended area.
Is this state collected data? Some of the state borders are suspiciously obvious. Colorado in particular seems to be way off. A dead giveaway is the eastern border. Why is an arbitrary line through the high plains about the most abrupt boundary on the entire map? I’ve been along the KS-CO border and it seemed physically and culturally identical on either side to me.
Make of that what you will (source).
ETA: the above is the 2009 CDC summary (of 2007 data), the pre-print of the paper that was summarized in the article Scott links is here, but also uses (slightly more recent) BRFSS data.
Thanks. I wonder if the extreme concentration of the population in many parts of the West screws with their modeling. Hardly anybody lives in the High Plains. If say only a couple random calls reached eastern Colorado border area perhaps the model by necessity pulled them towards the large and very culturally different cities on the Front Range that got hundreds random calls. Still the boundary is so abrupt they are must privilege being within the same state over geographic proximity somehow.
It should be fairly easy to study lab rats in identical environments except for CO₂ levels for a few months and see what happens.
Exactly what I was thinking. No idea why this hasn’t been done yet (apart from funding I guess, but if the skeptics are to be believed getting funding for anything is easy as long as you can tie it to climate change).
The costs of keeping a bunch of rats in a cage alive for 6 months would hardly be worth counting.
How to keep them in an atmosphere with a certain CO₂ level I don’t know. That might cost serious money.
I suspect race/ethnicity may be playing a role here too. The dark red area in the lower Mississippi is probably due in large part to the large black populations in those areas. Back in the day, was cotton grown in more mountainous parts of the South? If not, that’s going to explain a lot of the difference.
Similarly, there might be a “seeds of Albion” factor at work too.
http://www.censusscope.org/us/map_nhblack.html
Yes. The famous “Black Belt” which matches the 1860 cotton production map seems visible to me. The more rugged (and poor white) mountain areas are also visibly red however. The light colored band stretching into the South is the more prosperous Piedmont area. It parallels the mountains but is at a low elevation.
My immediate thought upon hearing about a potential altitude-obesity connection is that cities tend to be located in valleys or along the coast. Nobody builds cities on steep slopes or arid plateaus.
My second thought is that rural Americans can be pretty fat too (Arkansas isn’t renowned for dense cityscapes). Apparently those sinister urban elites have lower rates of obesity.
And my third thought is that maybe flatness creates fatness because it encourages people to drive everywhere.
“maybe flatness creates fatness”
In Los Angeles, rich people traditionally live in or near the hills, perhaps as a defense against invading hordes during the long awaited L.A. Apocalypse. Rich people are of course skinnier on average, but it strikes me that flat neighborhoods in L.A. are actually much more conducive to walking and bicycling, while mountain streets tend to be dangerous for all except motorists.
I assume LA has a level of density that makes walking and bicycling worth while even in flat areas, I imagine this is true in most big cities. When I read flatness creates fatness I thought of low density small town sprawl, like Plano Texas.
Mountain streets are dangerous for the motorists too- check out serious-injury-accident rates!
Actually, just ’cause I’m putting the finishing touches on the project paper for my Experimental Stats class, maybe people would be interested to know that our analysis found significant negative relationships on injury-in-accidents from intersections, female passengers, and night driving, and significant positive relationships from driver BAC, whether the accident had multiple cars involved, and whether the accident was speeding-related. Data was from Arizona, 2014, so limited dataset, of course. (Still around n=1500)
Any hypotheses? The positive correlations all seem to have obvious explanations. The negative ones are a little more interesting.
Intersections could be explained because speeds are typically lower.
Night driving might be because more collisions are due to poor depth perception, rather than not seeing the other car, I guess. That would result in more accidents, but a lower percentage of injury. (For example, other cars have lights on so you know they’re there, but you might be more likely to rear-end someone because you can’t tell the distance as well. So if night driving increases the number of low-velocity collisions, it would reduce the expected rate and severity of an injury from any given accident.) I suppose that more accidents aren’t necessary to explain the data. If headlights alert people to other cars, this could cause a decrease in total collisions as well as a decrease in expected-injury-per-collision.
The female passengers bit is interesting. I’m assuming that “passenger” here means “non-driver occupant,” like it usually does, but that seems weird so I’d like to make sure. A quick browse on Google gives some of the following observations:
-Men drive about 40% more miles than women do per year.
-Men are in more accidents total than women are.
-Male drivers have more fatal accidents per mile driven than women.
-Women have more accidents than expected for the percentage of drivers they make up; men have fewer.
So… Females are less likely to die in car crashes. None of the sites Assuming “passenger” has the traditional meaning of non-driver occupant, I see a few additional possibilities:
-Same-sex friendships are more common than inter-sex friendships, meaning female drivers are more likely to have female passengers. Having a female passenger could act as a proxy for being female.
-Maybe drivers are less reckless when passengers are present. Female passengers are a subset of passengers. Could be tested by comparing the effect of female non-drivers vs male non-drivers, or by looking at reckless driving (maybe using speeding as proxy?) with vs without passengers.
-Maybe female passengers have a moderating influence on the driver that male passengers don’t. I can’t think of how to test this except by ruling out other possibilities.
-Maybe females are more likely to be passengers under safe conditions (night driving?) and less likely to be passengers under unsafe conditions (e.g., are less willing to be a passenger with an intoxicated driver).
I’d like to hear your thoughts and/or conclusions.
Bassicallyboss, re: female passengers, I would assume that rather than a female passenger being a proxy for being female, a male passenger is a proxy for being male; fully all of the couples I know, when they drive together, do so with the man in the driver’s seat and the woman as the passenger. As in, if I’m picturing a setup with a female passenger, I could just as easily see it being her riding with her friends, or her riding with her husband/boyfriend. But if I’m picturing a male passenger, my gut feeling is that it is much more likely for a guy to be driven by his male friend than by his female spouse or significant other.
I think this could play off of the “Women have more accidents than expected for the percentage of drivers they make up; men have fewer.” bulletpoint of yours.
I suppose it would also depend on what is meant by “negative correlation with female passengers” — as opposed to male passengers, or no passengers? Or either?
This is all completely gut intuition and guesswork, of course.
The Laurel Canyon neighborhood in the Hollywood Hills was home to many rock music celebrities, but it was a death trap for trying to walk anywhere due to narrow windy roads and few sidewalks.
A lot of Los Angeles fashions in neighborhood designs were driven by imitating what celebrities valued, which was privacy. So in L.A. lots of affluent nobodies live in inconveniently laid out neighborhoods that would have been a good place for Rudolf Valentino to live to hide away from his fans, but is bad for people who like to walk.
It seems like something at least as important to control for as activity levels would be any known differences (assuming there are some) in the average dietary composition of people at different altitudes. I’d guess, for example, that people in the mountains tend to eat more protein and fat, on average, and people in lower altitudes more carbs (I’d also guess one might see a similar relationship between coastline and inland areas due to availability of seafood or lack thereof). Certainly at extreme high altitudes, not much grows, hence the meat and dairy-heavy diet of e. g. Tibetans.
Might also get more vitamin D at higher altitudes? People probably get more vitamin D in general now, so if it’s true that has an effect, it could also explain the big jump in obesity in recent decades, and why it apparently isn’t as bad at higher altitudes, where you get more UV in less time.
This is a pretty dramatic argumentum ad rectum, and it is in fact not unusual for people to notice that significant altitude absolutely kills their appetite for anything that isn’t mostly 1) sugary starch or 2) salty starch.
I said it was just a guess, not an argument. The point was that there might be some differences, not that I know what they are. Historically, however, I’d expect availability to be a bigger factor in determining what people eat, rather than what they feel hungry for.
In the US, though, availability is rarely a factor. Supermarkets everywhere have the same things, and unless you’re a locavore or in a food desert, that’s where your food comes from.
I have lived in flat, coastal areas and mountainous, inland areas in the US, and in the North and in the South. By the seashore, seafood is, unsurprisingly, relatively cheap, plentiful, and fresh. In the mountains, it is not. You can buy it, of course, but it’s frozen, more expensive, less varied, less tasty, and people have less of a habit of serving it. You are less likely to see it on the menu. In the South certain fruits and vegetables are cheaper and tastier than in the North. In places conducive to raising cattle beef is cheaper and tastier and local recipes more likely to include it, etc. etc.
Certainly it’s a much smaller factor than in the past, but the past also shaped peoples’ habits such that, even if they can now afford expensive, frozen fish at the grocery, if their ancestors were more partial to pork and pork is still easier to raise there, they will tend to continue to cook a lot more pork.
Have there been any studies showing that a change in gut bacteria has resulted in a change in a person’s level of obesity?
Yes, apparently fecal transplants from thin people got fat people to lose weight. Don’t have a link handy but that should give you something to start your search.
Another factor to consider is that the advent of widespread antibiotic use began in the late 1940s and several generations of infants now have compromised microbiomes as a result. Obesity is one of many secondary maladies associated with a reduced diversity of micro-organisms in the digestive tract.
I kind of wish the anti-carbon people had led with the “increasing the concentration of a bioactive atmospheric gas worldwide is a really bad idea” thing instead of climate change. Seems easier to understand and bellyfeel and doesn’t require trusting the models of activists.
And it’s easy to say “oh, if climate change becomes a real problem we’ll just use geoengineering to blot out the sun or w/e”, but problems caused directly by carbon dioxide in the atmosphere are harder to just hack around.
>I kind of wish the anti-carbon people had led with the “increasing the concentration of a bioactive atmospheric gas worldwide is a really bad idea” thing instead of climate change. Seems easier to understand and bellyfeel and doesn’t require trusting the models of activists.
That would have been a very weak argument. “This thing might cause problems, who can tell?” versus “here’s the evidence this thing causes this specific problem”.
And if the reaction to *that* is anything to go by you’d have the same people declaring that obesity is good for you and that CO2 is so good for you that they want more of it and that there isn’t really obesity because they saw a thin person this morning.
The difference is “air you breath every day may be altered in some sinister way” vs. “scientists say products you depend on every day may be altering polar ice caps in a way you can’t really understand which might be dangerous to your grandchildren somehow.”
Perhaps due to toxoplasma, I find environmentalists are especially constitutionally unwilling to make arguments which might appeal to people who don’t share their priors.
In general, though, it seems good to ground policy arguments in the actual reasons for supporting that policy. Scott’s speculating about the health impacts of carbon dioxide; global warming is the subject of intensive research, which is what triggered the attempt to do something about it policy-wise.
Also, I’d encourage you to think through how the scenario in which environmentalists lead with the speculative argument that carbon dioxide is a health risk and imagine how that plays out. You really think that’s an effective persuasion message?
Probably; it worked with nuclear power.
True arguments form an extremely small and constrained subset of the set of all possible arguments. The normal reason for making an argument is to persuade someone of something, probably for reasons that benefit the one making the argument.
Consequently, true arguments always always seem unpersuasive when
compared with normal arguments. Nothing in them speaks to your heart or gut,
because, unlike normal arguments, they were not market tested and focus
grouped to engineer that effect.
Uh, if Nuclear power had taken off in the 1960s, and new safer designs (pebble bed, liquid sodium cooled etc.) had been brought online, nuclear waste reprocessing plants been built etc., would we be *having* a discussion about carbon dioxide causing global climate change?
> did global warming cause the obesity epidemic?
Maybe the obesity epidemic caused global warming. After all, CO_2 emissions are correlated with consumption…
That’s actually not Appalachia showing up on the map, it’s a bit too far east and at the wrong angle. That line contains Washington DC and Baltimore and misses West Virginia entirely. Not sure what it is, but topographically (in Virginia) it’s what’s known as the Piedmont – the topographic region between the tidewater and Appalachia.
You’re right, it is a line roughly from Atlanta to NYC, though Baltimore itself is in the most-obese category and Baltimore County the next one down. That extension eastward towards the North Carolina coast might be the Research Triangle, and the smaller extension to the north, Richmond.
I don’t think topography is the cause for that feature.
Is it just me, or isn’t the Colorado/Kansas border one of the most striking features on the map? The entire western border of Colorado — neighboring Kansas, Nebraska, and even that tiny bit of Oklahoma — is an entirely straight line between some of the lowest vs some of the highest incidences of obesity. Everyone thinks of Colorado as mountainous and Kansas as flat, sure, but it’s not like you suddenly drop off a cliff when you cross the border! The people on either side of that state line are living under essentially the exact same geographical conditions. Why the difference?
-Is Colorado’s government doing something very right, or is Kansas doing something very wrong?
-Is there some kind of cultural self-selection effect, where people who think of themselves as healthy and outdoorsy move ten miles down the road so that they can leave behind the endless flat cornfields of boring-old-western-kansas in favor of the endless flat cornfields of rugged-attractive-eastern-colorado?
-Is there some bizzare historical/economic situation along the Kansas/Colorado border, such that actually very different groups of people live in these two identical patches of land, and they all live very different lives and eat very different food?
-Is it just random noise that happens to perfectly match the state border?
What the hell is going on?
The data apparently is collected separately by each state, although its overseen by the CDC and the states are supposed to ask the same questions.
From the data FAQ:
It could be that Colorado’s data is due to a unique quirk of their data collection methodology. This seems more likely than any other possibility I can think of.
It’s not uncommon for sharp state borders to show up in county-level maps of health. This is probably due to different measurement methodologies used in different states.
I’ve driven across that border a couple of times in recent years and there is no abrupt change in topography. I can’t tell you what the people look like, other than gas station clerks.
On the other hand, while some of the Colorado – Kansas disparity is probably a methodological artifact, Colorado does have a self-perpetuating culture of outdoor exercise that attracts vigorous people to move to Colorado to be around other people like themselves.
But most of them will move to the Front Range cities, the Rockies themselves, or to the mid-altitude Great Basin (e.g., Grand Junction). Few people move to eastern Colorado.
I assume the map is drawn with county lines or something similar, so is it possible that the people on the Colorado side of the border are fatter, as long as the whole county is skinnier? This map might not pick up on a gradual change across the combined distance of a Colorado county boarding a Kansas county.
Altitude is a very interesting variable to consider when thinking about getting a second home that you will later retire to. A relative of mine spent years building the perfect retirement home in an alpine paradise at 9,000 feet, but then the thin air proved troublesome with age.
Another relative of mine moved from Santa Fe to Albuquerque to start up a software company. I said I would have thought Santa Fe would be more attractive to top employees. He said it would, but the altitude (7200 feet) is too high to get full work out of many people, so Albuquerque’s more moderate altitude is better for the boss (himself).
Altitude and latitude both affect temperature. Going up 1000 feet in elevation will typically lower the temperature by about 3.6 degrees F. Unfortunately, I don’t know the rule of thumb for going north one degree of latitude.
Thus, higher elevation in southerly latitudes makes for a much milder summer climate. For example, the average high in Phoenix, AZ in July is 106 at 1,100 feet elevation. But in Sierra Vista, AZ near the Mexican border, the elevation is 4,600 feet and the July mean high is only 92.
When thinking about nature/nurture questions, altitude is a fun variable because it varies a lot and because it’s very clear cut.
“Anyway, this is boring.”
Personally, I’ve always found altitude to be obsessively interesting.
I’m am incredibly skeptical of that original obesity study. Just on a quick run through I see two huge problems.
First, the BRFSS data they use as their measure of obesity is entirely self-reported. Self reports of anything are notoriously unreliable, and when this particular data was compared to actual measurements of obesity, it was found that not only do people lie egregiously about their weight AND height, but people in different states lie by different amounts.
See the study here, especially Figure 3 and Table 1. One particularly striking example- the map in the original study shows California mostly light yellow, while Tenessee is almost entirely dark red. Le et al’s paper shows that 28.2% of Tenesseeans report being obese, compared to only 25.5% of Californians.
When you actually weigh people, it turns out that in fact 31.9% of Californians are obese, with Tennessee actually slightly slimmer at 31.7%. Unfortunately we can’t make a cool map like this with the somewhat more limited data on actual measurements, but you simply can’t take this kind of self-report data at face value.
Second, every additional thing that a study controls for makes me more skeptical of it. This is doubly true when they are “controlling” for vague, hard-to-measure things that they don’t actually have solid data on.
There seems to be a pretty common trend of people wanting to control for X, but since they don’t have X they control for X_1, a completely different thing that can be a decent proxy for X in some situations. They then declare that they’ve controlled for X and go through the rest of the paper talking about how none of the effects they’re observing could possibly be anything X-related, because after all they’ve controlled for that.
Here its exercise. They say they “controlled for physical activity”, but they did not. They controlled for how people self-reported (ew- see the first problem) exercise, which isn’t quite the same. Exact wording:
Right away they cut out physical activity as part of your job, which is often significant and for particularly strenous jobs can more than double daily energy requirements. They go on to ask about how often you exercise in followup questions, but only for the top two specific activities.
These questions will give you a pretty good summary of physical activity for most people. Unfortunately the differences between this and actual physical activity are the kind of thing that will vary tremendously by location, so trying trying to use this to correct for county-level obesity rates is pretty bold, even without the self-reporting issue. For example, living on a steep incline (for example, in a high-elevation county in the Rocky Mountains) will probably significantly increase the amount of energy burned just going about a normal day, even before any exercise.
Ultimately though the self-reporting issue is just so egregious it makes going through the rest of the study a bit pointless.
Right away they cut out physical activity as part of your job, which is often significant and for particularly strenous jobs can more than double daily energy requirements. They go on to ask about how often you exercise in followup questions, but only for the top two specific activities.
Good point: suppose I don’t walk for exercise, but I do walk a round trip of a mile and a half each day because I walk to and from work? Or that my job is as a construction worker so I am physically active in it? Does housework count? (Yes, even with labour saving devices, you can do some physical exertion there). People will both under- and over-estimate how much physical activity they engage in.
https://www.ncbi.nlm.nih.gov/pmc/articles/PMC4113517/
https://www.eurekalert.org/pub_releases/2011-03/uocd-ssl032511.php
Longevity and altitude
I have read about some athletes and life extensionists spending regular time or even sleeping with/in a low-oxygen mask or tent, the theory being that mild, temporary hypoxia causes the body to hormetically compensate in some healthy ways (and I think beyond just increased red blood cell count, though that’s probably part of it).
The strong but unwritten rule is that Chesterton;s Fence is actually about sex.
That’s news to me.
Everything in the world is about sex except sex. Sex is about power.
Y’all are missing the obvious: we’re being fattened up. The plot from “To Serve Man” is in motion.
As for Japan- they have experienced an increase in obesity, even if it’s moderate in comparison to the USA. Their government is concerned enough by this to have imposed invasive and very un-PC annual check-ups.
On the plus side, perhaps this will decrease support for whale hunting in Japan.
Is the obvious conclusion that people are tastier in some parts of the world than others, then?
A controlled experiment where obese subjects were ferried to the Swiss Alps, told to eat as much as they want, and banned from exercising
Not to be flippant (well, maybe just a little) but where the heck can I sign up for studies like this? They’ll fly me to Switzerland, put me up in fancy resort-style accommodation*, tell me to stuff my face with goodies, actively encourage me not to lift a finger or exert myself in any way, and I still end up losing some weight anyhow? Why don’t I ever get asked to do this kind of sampling, instead of (e.g. in school) “Department of Education and Department of Health joint study on childhood obsesity levels – yes, the little porkers are lazy lumps of lard who don’t exercise and eat too much junk, and we’ll prove it by getting the fattest kid(s) in gym class to do controlled periods of exercise and show that they’ll give up in no time because they just aren’t fit enough and have no willpower to stick with ‘no pain, no gain'”*
*If it’s a Swiss clinic conducting the study, that’s close enough to “resort-style accommodation” for me 🙂
**You may perhaps detect just a smidgeon of resentment over being selected as a guinea pig for this one
This began with a map. Do you mean that one should use xenoestrogens and gut microbiota to explain the map?
I would expect mountainous areas to be less densely populated, which in turn means the obesity rate is going to be more extreme in those areas.
I’m not sure if there’s any way to control for that or if the effect would be large, but it came to mind when looking at the map. The Western mountains look lighter overall, but they also seem to have less resolution, so they could be more easily dominated by a few population “centers.” The only really light areas look like ski areas + salt lake city + maybe coeur d’alene; take that into account, and it looks like “the upper midwest, but population centers statistically dominate a much larger area around them.”
Alaska doesn’t really have enough resolution to tell, but eyeballing I’d say the mountains (running east-west across the north-central part, and the pandhandle) are actually fatter, but nobody lives in those mountains so that’s not what’s going on.
edit–I also don’t see any effect in the Ozarks.
edit 2–you say it’s not related to population density, but it does look that way to me.
Hypoxia of high altitude leads to a compensatory rise in red blood cell mass within six weeks and, consequently, to more viscous blood. I just dug around a bit on this, and at first everything pointed in the opposite direction, toward more obesity and metabolic syndrome associated with higher RBC aggregation (Gyawali, Clinical Hemorheology and Microcirculation 2014;57:73–83, as well as Vaya et al, 2011;49(1-4):493-503 and a lot more in the same journal mostly, just poking around in related articles on PubMed). RBC aggregation is actually proposed as a potential inflammatory biomarker for assessing metabolic syndrome progression. Whether there are direct causal effects involved and, if so, which way the causality arrow runs, is unclear — it’s not uncommon for metabolic physiology studies to assume obesity is the driver of whatever’s being described and not vice versa — and how any of this this dovetails with lower observed obesity rates at altitude, I can’t say. I do see a lot of hits on weight loss associated with polycythemia vera, but that’s, you know, a hematologic cancer and I wouldn’t want to extrapolate from it. Searching from an exercise physiology angle, on the other hand, turned up this public domain review (Palmer, Obesity 2014;22:311-317) which seems much more promising and may be of some use to you?
Global Warming, you rascal! Is there ANYTHING you can’t do!?
Looking at the map, the thin patch ends right where the Rockies do …. but the Great Plains are also high-elevation, higher than the Appalachians in many places. That in itself makes me suspicious.
Fascinating.
Are there home devices like humidifiers or dehumidifiers for reducing the CO2 indoors? I did a little desultory googling, but of course all it finds are pieces about wholesale removal from the atmosphere at large.
Anything to give me an excuse not to get on the treadmill today…
Yes, they are called houseplants.
Wow, that calls for a lot of plants. Guess I need to go buy a bunch more.
Get some grow lights and block out all your windows.
2000x atmospheric CO2 is 80% CO2. No animal can possibly survive that kind of CO2 concentration. The abstract says 10%, which is about 250x atmospheric(and near lethal for humans at least).
Several people mention the altitude of the Great Plains. These are visible on Scott’s map as vertical stripes of light green, yellow, and brown east of the Rockies. Kansas steadily climbs as you go west. But the biggest cities — Kansas City, Wichita, Topeka, Manhattan — are on rivers at 1000′ elevation, defying the trend. Picking out towns on I-70 that I’ve never heard of, Russell is at 1800′ and Oakley at 3000′. (Dodge City is at 2500′.) But there is no east-west gradient on the obesity map across Kansas. Possibly this is a shortcoming of BRFSS, which doesn’t sample these small towns.
I wonder, has anyone compared how well obesity correlates with elevation in the U.S. versus how well it correlates with Colin Woodard’s mapping of the various cultural regions of North America? Some of his regions (the Far West and the Midlands, for instance) seem to show up on the obesity map, although that might be some elevation or some other topographical feature funneling the historical patterns of migrations, or just plain confirmation bias.
If I might drop into the meta contrarian basement for a moment. Does anyone know of good countervailing evidence for the average energy density of foods hypothesis?
Switzerland would probably have some interesting results in a study like this, because they’re neatly divided into mountains and lowlands, but also because they have the I believe the lowest obesity rate in the Western world.
It’s light pollution. Specifically blue-wavelength light that people were unable to produce cheaply (outside of unappealing-for-other reasons fluorescent lights) until relatively recently. The effects of shift work on health (obesity included) have long been well understood and are attributed partly to exposure to blue light during the night, exposure we are now all increasingly getting due to LEDs replacing low color temperature incandescent and mercury vapor outdoor lights.
People in the mountains are more hidden from this light pollution which I suspect is the cause of this map and effect.
I know back in the day there was a Discover article talking about a study being done (I couldn’t find this anywhere online now) that was trying to simulate elevated CO2 levels on plant growth. The basic idea was this: boosted CO2 increases plant growth, but the kinds of plants that are boosted the most are relatively low nutrient plants. So you have a situation where herbivores had to produce very large stomach capacities in order to digest all the food they had to eat to get basic nutrients, and this resulted in massive increases in herbivore size to accommodate the increased stomach sizes. Well, something like that. I may have missed an important point or misremembered it. IIRC, the numbers they were floating at the time were between eightfold and sixteenfold increases in modern CO2 levels, so much much more substantial than anything I think people expect to see even in very dramatic climate change scenarios in the modern era. But the link between carbon dioxide and body size in this case was presumed to be nutritional, not something that occurs merely by inhaling carbon.
Aerobic respiration generates 15 times more energy per glucose molecule than anaerobic respiration. Oxygen levels decrease with altitude, leading to more anaerobic respiration, and thus to burning 15 times more fuel to get the same amount of energy.
It seems like experiments to test the relationship between oxygen levels and weight loss/gain would have been done already. Anyone know of any?
“The IJO study finds that people living at sea level are five times more likely to be obese than people living at 500m elevation”
A few of us were discussing this on Facebook, and became confused, because 500m is such a small elevation. (For example The O2 concentration at 500m is 94% of what it is at sea level. The concentration in Denver is 83%, and the concentration in Lhasa, Tibet is 65%.)
It turns out that 500m is the increment that they used to divide up elevation cateogories, not the elevation at which they saw a large effect size. The large 5x effect was seen at 3000m+ elevation (which is much higher than any large city in the US).
Here are the relevant graphs from the original paper.
http://imgur.com/a/vKXhj
Good catch!
I’ll admit up front to having read only about half of the comments on this post, so this may have been hashed out already, but the one thought I would add is that positing a causal relationship from CO2 rises to obesity simply because the two increases are correlated seems more than a little dicey even if you could find a few small-scale trials that seemed to support the conjecture.
For instance, it seems at the very least equally likely to me that one of these two scenarios is true (barring the possibility that the correlation is simply coincidence, of course):
1.) Obesity caused carbon dioxide levels to spike, not the other way around. In this scenario, as Westerners got fatter, they turned to more energy-intensive and thus carbon-intensive options for work and recreation.
2.) Another phenomenon — more sedentary lifestyles, higher dependence on technology for work and play, etc., etc. — simultaneously caused increases in obesity and carbon emissions.
I’m going with #2, myself. Not as fancy and headline-worthy as “Carbon emissions make you fat,” sadly.
The answer seems so obvious to me that I’m commenting two weeks late.
These are areas with farms. Farms are in flat places. People in farming areas have traditions of high calorie food, like the south or midwest.
I’m getting here really late, but as a former submariner, I felt that I have some meaningful information to share.
The number of extreme factors that make up submarine lifestyle are probably so confounding as to remove any meaningfulness away from CO2 considerations.
We can use a lot of compressed air to use some of our equipment on occasion – this air when used fills the people space. We have compressors to pump it back into the air tanks. This results in some pretty wild pressure transients at times. I don’t know specific numbers (nor am I sure of the classification status of them), but what I can safely say is that several times in any given week, I’ve gone pressure changes equivalent to elevation changes of thousands of feet. Forget about CO2 concentration levels, the O2 changes that happen as a result are also just a complete mess. Whenever we snorkel with the diesel, it also draws a pretty large vacuum on the ship.