
Last night I asked Tumblr two questions that had been bothering me for a while and got some pretty good answers.
I.
First, consider the following paragraph from JRank:
Terrie Moffitt and colleagues studied 4,552 Danish men born at the end of World War II. They examined intelligence test scores collected by the Danish army (for screening potential draftees) and criminal records drawn from the Danish National Police Register. The men who committed two or more criminal offenses by age twenty had IQ scores on average a full standard deviation below nonoffenders, and IQ and criminal offenses were significantly and negatively correlated at r = -.19.
Repeat offenders are a 15 IQ points – an entire standard deviation – below the rest of the population. This matches common sense, which suggests that serial criminals are not the brightest members of society. It sounds from this like IQ is a very important predictor of crime.
But r = – 0.19 suggests that only about 3.6% of variance in crime is predicted by IQ. 3.6% is nothing. It sounds from this like IQ barely matters at all in predicting crime.
This isn’t a matter of conflicting studies: these are two ways of describing the same data. What gives?
The best answer I got was from pappubahry2, who posted the following made-up graph:
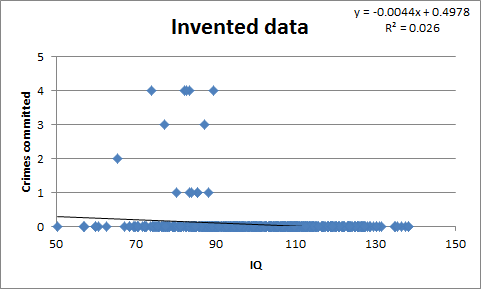
Here all crime is committed by low IQ individuals, but the correlation between IQ and crime is still very low, r = 0.16. The reason is simple: very few people, including very few low-IQ people, commit crimes. r is kind of a mishmash of p(low IQ|criminal) and p(criminal|low IQ), and the latter may be very low even when all criminals are from the lower end of the spectrum.
The advice some people on Tumblr gave was to beware summary statistics. “IQ only predicts 3.6% of variance in crime” makes it sound like IQ is nearly irrelevant to criminality, but in fact it’s perfectly consistant with IQ being a very strong predictive factor.
II.
So I pressed my luck with the following question:
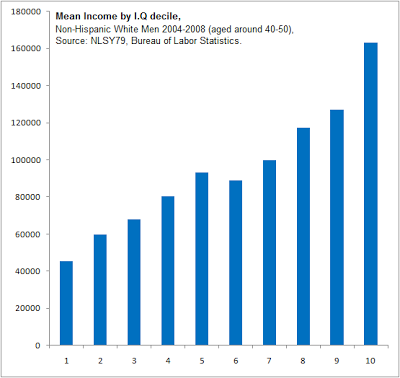
I’m not sure why everyone’s income on this graph is so much higher than average US per capita of $30,000ish, or even average white male income of $31,000ish. I think it might be the ‘age 40 to 50’ specifier.
This graph suggests IQ is an important determinant of income. But most studies say the correlation between IQ and income is at most 0.4 or so, or 16% of the variance, suggesting it’s a very minor determinant of income. Most people are earning an income, so the too-few-criminals explanation from above doesn’t apply. Again, what gives?
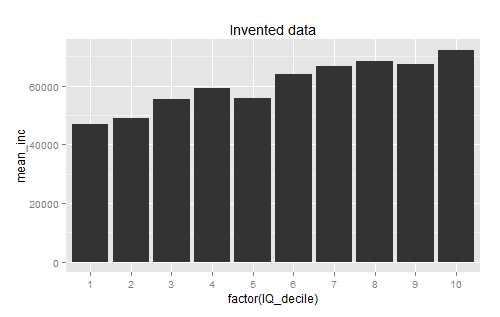
The best answer I got for this one was from su3su2u1, who pointed out that there was probably very high variance within the individual deciles. Pappubahry made some more graphs to demonstrate:
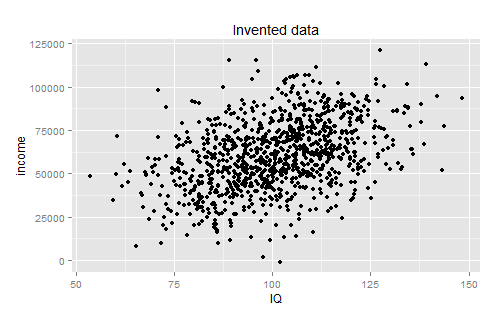
I understand this one intellectually, but I still haven’t gotten my head around it. Regardless of the amount of variance, going from a category where I can expect to make on average $40,000 to a category where I could expect to make on average $160,000 seems like a pretty big deal, and describing it as “only predicting 16% of the variation” seems patently unfair.
I guess the moral is the same as the moral in the first situation: beware summary statistics. Based on the way you explain things, you can use different summary statistics to make things look very important or not important at all. And as a bunch of people recommended to me: when in doubt, demand to see the scatter plot.


Yeah, I guess shorter posts is technically “less blogging.”
I’m halfway convinced that every time he claims he’s going to be doing less blogging, he’s actually just testing the theory that saying he was going to do less blogging is what caused the big drop in readership he described a few posts ago.
Of course. Shorter posts are “less blogging”, whereas a reduction in the number of posts would be “fewer blogging”. 🙂
At least we are covering IQ here. If you are going to waste time blogging about how unreliable summary statistics are, it’s always good to do it with a notoriously unreliable summary statistic like IQ as your baseline.
GIGO all day baby!
Sigh, IQ is unreliable? Actually, IQ test scores are among the most reliable (repeatable) test scores in psychology.
Please try harder next time.
That’s like saying coral it’s the driest life I the ocean.
The income one is probably also distorted by rare outliers, this time ones who make orders of magnitude more than anyone else. Thus the mean is probably not a good measure to use.
Yes. Although NLSY79 topcodes income, so this will be minimized somewhat. They actually do it in an interesting way: they take the top 2%, average them, and give everyone in the top 2% that value.
I’d go with a combination of
a) that. Median income is about $30K. US per-capita is about $50K. Outliers matter.
b) Half the population doesn’t work, so per-worker-capita is about $100K, which is roughly the mid-point on that graph.
c) 40-50 is probably close to the highest earning point in anyone’s career.
Are you sure (b) isn’t already taken into account by the $30k figure?
Age cohort has a much larger effect than generally realized:
http://econlog.econlib.org/archives/2015/05/shocking_new_da.html
As far as I can see, your link is about net worth and not income. That people accumulate wealth (generally various forms of property while paying off loans) as they grow older – who hasn’t noticed this?
For the income one, think of binning as a method of smoothing data. It’s the same principle as Loess curves and ensemble bagging: averages smooth out and decrease variance.
In the first case, the issue is that p(low IQ | criminal) is very high, but p(criminal | low IQ) is still very low. People don’t have a good intuition for how those two things are very very different. Saying it’s a “strong predictive factor” I guess might be true relative to other predictive factors (low IQ predicts criminality better than height I assume), and it might be true in a relative sense (those with low IQ are 10x more likely to commit crimes), but that doesn’t make it true in an absolute sense.
One might also conjecture that high IQ people are less likely to get caught, and that biases the stats.
Also the implied model with a strict correlation is a linear relationship, which doesn’t make sense in this case. A zero-inflated count model would be much better. One could still describe it with the right summary statistics, just not pearson correlation (which is what the authors of that paper used).
The second case might make more sense if you put error bars on the bar plot. I don’t know if the BLS releases standard deviations but one could generate some fake data with the desired properties.
Related: http://en.wikipedia.org/wiki/Anscombe%27s_quartet
What still blows my mind is Simpsons Paradox
“All things with a star on their belly are sneetches, but not all sneetches have stars on their belly.” Especially after that Silvester McMonkey McBean shows up with his machine.
Aye, and they have high incomes, political influence and community respect, perhaps even elected office. We just don’t (usually) call them criminals.
Ah, Simpson’s paradox. Drove me insane for a very long time which is why it’s one of my favorite paradoxes. I feel like I didn’t understand it fully until I worked through Pearl’s Causality.
But if you want to build some intuition quickly, I like this picture:
http://singapore.cs.ucla.edu/LECTURE/section3/sld005.jpg
(For some reason) Small fish swim for the small mesh net. Large fish swim for the large mesh net.
Looking only at the final catch, you have a lot more small fish. But each net (individually) would surely catch more large fish than small fish.
Something important to note is that the “reversal” you see with Simpson’s paradox cannot happen with causal interventions. There has to be some kind of confounding factor. The paradox is so counterintuitive because we’re used to thinking of conditioning as being like an action that we take instead of a passive observation.
I am somewhat fearful that I screwed up the explanation here and Ilya Shpiter is about to enter this thread and tell me how wrong I am…
Am I crazy or is it enough to just say this to explain the paradox:
A1/B1 + A2/B2 ≠ (A1+A2)/(B1+B2)
The real trick is not only explaining why that happens, but explaining why we are surprised (that is what Pearl did).
Incidentally, I think the Newcomb paradox is of the same type (an explanation exists in terms of representational expectations).
Hello,
I am a little sad that this might be my reputation around here, but I suppose these things do not arise in a vacuum, and it is on me to do better. I don’t know if it helps, but I get things wrong all the time — math is hard! I think there is a post by me in the past out on the internet somewhere, where I got the Simpson’s paradox explanation wrong, actually. Please don’t let the possibility of being wrong discourage you from posting.
And I will work on not coming across as a “math ogre.” 🙂
The last thing I want is to discourage any discussion of causality for fear of me pouncing from the shadows.
For what its worth, I am very glad to have you here since you are one of the few commenters who really knows on a deep level what they are talking about. I’m sure a lot of commenters value your presence here as well.
I have occasionally felt a similar feeling of hesitance. But its not that I’m scared of you or another commenter unfairly berating me. I’m afraid of being wrong. But I think being wrong isn’t a reason not to comment, its a reason for me to be humble and open to learning when I’m trying to talk about something I don’t yet fully understand.
You could be a Mensa-member genuine certified genius house painter, and you’re still only going to make a certain limit of income (unless you decide to rebrand as an interior design consultant) while someone not as high IQ as you but, for instance, a financial controller in a fairly big company would make a higher income. If you’re high IQ, you’re going to be steered towards academic pursuits and “the professions” by schools and career advisors etc. And as you get older and have more experience in the field, the wages generally go up.
And there may be strange blips in the results; looking at this site which I pulled up to see what income ranges for different jobs were, apparently for financial controllers “Pay for this job rises steadily for more experienced workers, but goes down noticeably for employees with more than 20 years’ experience.”
That’s odd and I can’t understand it. On the face of it, there would be a point where in your 40s or so you’ll hit the ceiling for pay, then as you get older and (one would presume) more experienced in the job, your value goes down? I’d expect that for high-tech jobs where younger is better because less fixed mindset, more up to date, and so on – but not for jobs where knowledge of market trends and past performance is relevant, and keeping up to date on new legislation is simply a matter of learning the damn codes and implementing them.
A hypothesis about financial controllers: pay starts going down with experience because the good ones eventually get promoted to a different job. In other words: conditional on you still being in the job after 20 years, you’re probably not particularly skilled at it. The skilled financial controllers start out paid ok, get raises and promotions and such, and then get promoted out of financial controller. So you see their contribution to the increasing salary with experience for a while, but then they all leave.
That idea struck me when I was reading the Horatio Hornblower novels, which made a big deal about the Royal Navy using a very small number of officer ranks, relying strictly on seniority (specifically, time you’ve been your current rank) to determine which of two people of the same rank should be giving orders to the other.
To a certain degree it made sense: someone who’s been a Lieutenant for two years is probably better at Lieutenanting than someone who’s only been a Lieutenant for three months. But it breaks down when you’re dealing with someone who’s been stuck at Lieutenant for 15 or 20 years, as that indicates that he’s not good enough to get promoted to Captain.
It might be different elsewhere, but at least in the U.S. Army, you get two chances at promotion as an officer, and if you don’t get promoted, you get kicked out.
It was very different in the Royal Navy of the 17th through early 19th centuries.
Step 1: If you were of the right social class and wanted to go to sea (and could afford the fees), you were commissioned as a Midshipman
Step 2: If you were a Midshipman and passed a very thorough written exam, you were promoted to Lieutenant. There was no time limit on this; you could be a 40-year-old Midshipman if you were stubborn and clueless enough.
Step 3: ???
Step 4 – Profit: If you were a Master and Commander or Post-Captan, subsequent promotions occurred on the basis of strict seniority until you were dead, retired, or Admiral commanding the Royal Navy.
Step three was the tricky one. There was no rule or procedure for being promoted above Lieutenant, except that if an Admiral happened to need an extra Commander or Captain he could turn a Lieutenant into one on a whim. The essence of a successful career in the Royal Navy, then, was to arrange for an Admiral to Take Notice of one’s potential.
Being a Lieutenant for 20 years could mean that you’re just not that good at it, or it could mean that you are very good at doing something boring and unglamorous, or very good at doing things in detached commands far from the attentions of Admirals. Run the best damn middle gundeck on any Ship of the Line in the fleet, and if that ship isn’t an Admiral’s flag you’re never getting past Lieutenant.
To add to what John Schilling said, there was also a selection process involved in being assigned to duty, beyond the selection process for attaining a particular rank.
Officers were only on active duty when assigned to a ship, fleet, or other duty post. Between assignments, Captains and Lieutenants were on half-pay reserve status, and Midshipmen were civilians (as with enlisted sailors and technical specialists crew members, midshipmen were hired on by the Captain for a specific deployment and mustered out when the deployment was over). In order to get assigned to active duty, one of the following generally needed to happen:
1. Someone in command of a ship or fleet had a vacancy of your rank and wanted you for the job. A captain could simply hire a midshipman on his own initiative, and the Admiralty would generally assign a lieutenant to a captain or a captain to an admiral upon request if they were available.
2. Someone at the Admiralty got the idea based on your record and reputation that you’d do a good job at a particular assignment.
3. Someone at the Admiralty had gotten the idea that you had the talent to make a good senior officer and decided to give you assignments that would give you opportunities to distinguish yourself.
4. You had social or family connections to someone with the political clout to trade favors with someone in the Admiralty to give you an assignment.
5. The personnel resources of the Navy were stretched thin and the Admiralty would grab any warm body with the right rank for the assignment.
1-3 were far from perfect, but did tend to select for merit, and officers who got a reputation for marginal competence tended to find new duty assignments hard to come by, at least in normal time periods when there were many more officers than duty posts. Nepotism helped get people from well-connected families more and better opportunities to prove themselves, but even then, if you screwed up too big or too often, your relatives would stop sticking their necks out for you. #5 only came up rarely, such as at the peaks of the Napoleonic Wars.
Half-pay reserve status happened for Admirals, too. Technically, “Admiral” was a posting, not a rank. The N most senior active-duty people on the Captain’s List were given fleet commands (described by a rank (Admiral, Vice Admiral, or Rear Admiral) and a color (red, white, or blue) indicating seniority of that rank, derived from the historical division of the navy into three squadrons). Anyone the Admiralty wanted to skip over for fleet command despite seniority would be given the post of “Admiral without Distinction of Squadron” (informally referred to as a “yellow admiral”, by analogy with the color squadrons) and would collect a reserve officer’s half pay while enjoying the social status of a retired admiral.
There was also a Darwinian selection effect, due to the brutal an unforgiving nature of the naval operations themselves and the similarly brutal and unforgiving nature of the likely court martial if you lost your ship or failed in your mission and didn’t have the good grace to get yourself killed in the process.
Basically, if you screwed up big, you were likely to get killed at sea or get shot for cowardice or kicked out of the navy in disgrace for incompetence when you got home. You and your career would generally survive multiple missions only if you fought and won, you contrived to succeed in your missions without fighting, or you survived losing a battle that had clearly been lost through no fault of your own.
The mandatory court-martial for losing one’s ship wasn’t an automatic career-killer. It was for the most part a genuine “something went wrong here and we should figure it out before the next time” court of inquiry, and only an exercise in meting out punishment if the inquiry found a punishable offense. And being mandatory, it didn’t carry the “If he wasn’t up to something they wouldn’t have arrested him” stigma of a modern criminal proceeding.
And surrendering to a more powerful foe to avoid needless bloodshed was then considered a reasonable and honorable thing to do. Note that Captain James Dacres of HMS Guerriere, famous for his ignominious surrender to the USS Constitution, was given two subsequent commands of larger and more prestigious ships, made Rear Admiral on active duty, and retired as a (yellow) Vice-Admiral.
Much is made of Admiral Byng’s execution for “failing to do his utmost against the enemy”, as proof of the unforgiving nature of the 18th-century Royal Navy. But that was an exceptional case, and he had to work at it. Cowardice, incompetence, hypocrisy, and general assholery all at once, in the course of losing a high-profile battle of great strategic importance. Dacres’ example is more typical.
And in case anyone is wondering, Dacres’ escape from perpetual lieutenancy was a combination of Eric’s cases 3 & 4 – his politically connected father got him an assigmnent as aide-de-camp to an Admiral, who was in turn impressed enough to assign him temporary command of a small warship and see if he’d do something noticeable. Byng, son of an admiral, was straight-up nepotism, but apparently quite capable in his earlier assignments.
Labor economists typically throw in a square of experience (or age) term into their models trying to explain labor income. The non-linear relationship between age/experience/years of education and salary is quite common.
Cognitive powers decline starting in your 20s (just like overall athleticism).
For a while – possibly a long while depending on the area – a person is more valuable being less intelligent but with greater knowledge. At some point you’ve gained all the knowledge that you’re going to gain and all you have going forward is cognitive decline.
Helpful analogy – baseball players peak at 27-30 years old but sprinters peak much earlier. The knowledge and skill acquisition in baseball offsets the physical decline for longer.
Cognitive powers decline starting in your 20s
So everyone on here is over the hill? 🙂
Do we have any idea of the age-ranges of readers/commenters here, just to get a general idea of which of us are drooling incompetents sliding into second childhood and which of us are the bright young things?
Going first: I’m the former category. Just getting into my 50s. Definitely feeling the physical decline and probably the start of the mental as well.
That’s nice and cheerful to get you all going, yes?
I’m not 40 yet, but it seems like in the past few months I’ve started having “senior moments” significantly more frequently than before- things like going to the other room to get something and not remembering what it was I wanted when I get there, or thinking “what’s that word that describes how twitter mobs go after someone, it’s on the tip of my tongue, it starts with A.” (I figured it out by looking up “random” in the thesaurus- “arbitrary.”)
If what I have read of neuropsychology is even remotely correct, the cognitive powers start declining at birth, at least for a given value of powers.
Extremely simplified model:
With experience, often used neural pathways are reinforced and less used ones are ‘pruned’. This is known as learning. As the available pathways become fewer, a person becomes ‘set in their ways’ and have a harder time learning new stuff as well as a harder time coming up with genuinely new ideas.
The thing with a very young child is that any idea seems likely.
The sweet spot is when one is still able to generate new ideas and still have enough reinforced pathways to guard against utter nonsense. When this is seems to vary wildly from person to person.
Also, the decline can apparently be slowed by learning new skills and being exposed to new ideas that reinforce new pathways. I read somewhere that learning to ride a motorcycle after turning 40 had a measurable positive effect on the synapse level, I don’t know if that one was ever reproduced.
Also, when it comes to learning, as long as your current knowledge is not directly false, the lack of available neurons can be compensated for by branching off the existing well used pathways which is why it is easier to learn new material that is related to something you already know.
I don’t think I’m directly wrong about this, but I realise that my level of understanding is at the very bottom rung of Wittgenstein’s ladder here.
Oh, and I’m 45 and consider a day without learning at least one new fact/idea is a day wasted, so probably not totally brain dead yet 🙂
I’ve been feeling mental decline in terms of memory and raw computing power since about 15, and from what my parents have told me, it sounds like my memory has been steadily declining since sometime in the single digits. On the other hand, wisdom is more practically useful than intelligence, except when it comes to picking up useful skills, which I wasn’t doing much of back then anyway.
“What still blows my mind is Simpsons Paradox”
How do you feel about this picture?
http://postimg.org/image/g5582bcyd/
http://en.m.wikipedia.org/wiki/Anscombe%27s_quartet
This is a thing. Thanks David Juran!
If you want to have more fun, compare IQ with poverty, and compare poverty with imprisonment.
The fact that the IQ / Income correlation is counter intuitive to you should make you go back and re-think your assumptions about how IQ effects the world. My sense is that you have essentially been in the camp of, “societal outcomes are explained by IQ”.
To go back to Alex, Bob and Carol from growth mindset, those potential bars are significantly overlapping. Yes, over a large population of ABCs, the average of A outperforms the averages of B and C, but any individual Alex has a pretty good chance of being outperformed by lots of Carols.
The data itself isn’t counterintuitive, the way it sounds in different statistical summaries is.
Yes, but many of your blog posts have concentrated on just the statistical summaries. And your conclusion here is that the statistical summary can tell you a story that is partially to very misleading, especially in an intuitive sense.
Again, going back to the growth mindset example, the example you made up for Alice, Bob and Carol is a point of data about how you intuitively think about ability, and you made the bars essentially non-overlapping.
That doesn’t seem to map to what you already know about the percentage of variance explained by “ability” if ability is simply IQ.
One of the pairs of bars were overlapping, and the other pairs of bars were non-overlapping for illustration. I don’t see a problem here.
Also, the bars are not necessarily overlapping given that scatterplot. Those data points are individual people. We could generate a similar scatterplot given a model in which income is 50% genetically determined intelligence and 50% genetically determined charisma for instance*. You can make _no_ inference about the how variable someone’s eventual income is from that graph.
*Hopefully unnecessary disclaimer, I am not advocating this model, I am demonstrating why you can’t conclude that ability is variable from that graph. Many models can generate the same result.
It’s true that an individual persons “bar” for outcome of income may actually be small (given that imaginary dataset), but if the only data point you have is IQ, the prediction bar you should draw is large.
And if you back and look at the actual example you can see that Carol barely overlaps with Bob, rather than mostly overlapping, with the differences coming in the last 10% of the range.
Carol’s “laziest” bottom is Bob’s hardest working top end.
If you’re shifting from “potential bar” to “predictive bar” then yes I agree. But this tells us nothing about whether Carol can move along the bar by having the right mindset. Her level of success could be completely determined but we only have a fuzzy measure of it. We need more information to tell.
@Alexander:
Scott has numerous posts where he essentially regards IQ itself as essentially determining outcome. But the data Scott is pointing at here suggests that IQ is one of many factors, although it may be the most important factor, its is one of (likely) many that all have an effect.
In the post for the ABC example, Scott uses IQ several times as a proxy for overall ability. Although he does note that IQ is not the only factor in overall ability, he never mentions any other possible factor.
Here is the sentence that appears directly over the graph I linked earlier:
“Likewise, mindset theory suggests that believing intelligence to be mostly malleable has lots of useful benefits. That doesn’t mean intelligence really is mostly malleable. Consider, if you will, my horrible graph:”
Clearly Scott is treating IQ as determining the potential bar in that example.
No it does not, here is a model that would reproduce the data: success = IQ + randomness. There is no strict need to propose other factors to explain this data. This is a statistical point, and I feel a bit guilty pointing it out. But statistics is hard and its easy to make wrong conclusions or even correct conclusions with incorrect reasoning.
For the record I agree of course that there are many things that contribute to success. Almost everyone believes this, hence Scott’s rant about the “Bloody Obvious Position”. However, the data here alone tells us almost nothing.
@Alexander:
Note that I modified my statement about multiple other factors by including the word likely. I recognize we aren’t considering in this hypothetical what the other factors are. But even if it is just one other factor (randomness), it doesn’t change my basic point.
Scott is treating IQ as if it, by itself, can be used to reduce the possible outcomes to a small range. But even if the other factor is randomness, then it just means that the outcome is almost completely random and without cause or correlation.
Parenthetically: If that other factor was truly, truly random, like in some sort of a quantum way, that would be sort of deeply weird. Probably we really mean so complexly caused as to be undetectable. Or something.
“No it does not, here is a model that would reproduce the data: success = IQ + randomness.”
In that model, success is due to two factors: IQ, and some other factor that you’ve labeled “randomness”.
HeelBearCub
I think that I may have been reading into you more than what you actually wrote and been unnecessarily pedantic as a result. Because you framed this discussion terms of the growth mindset post, I read you as trying to “sneak in” your preferred explanations for success in a way that wasn’t warranted. In particular, the idea that for any given person, there is a wide range of potential levels of success they could achieve depending on their mindset or environment – which is not supported (or opposed) by the data.
But if you’re only claiming that IQ is not a hugely predictive metric on the individual level, then of course I agree. It’s exactly as predictive as the numbers show. Whether you call it “small range” or a “moderate range” is venturing into politics and I’d rather just state the actual confidence intervals.
@Alexander:
Ah, yes, I can see how that would be a natural assumption to make. I wasn’t actually trying to sneak in any any other explanation. The ABC graph was a handy illustration, but I wasn’t actually intending to address anything about growth mindset. I really just think that Scott’s posts have been more reductive than is warranted when it comes to using IQ as an explanation for outcomes.
I agree that describing the ranges as small, moderate or large doesn’t actually add much clarity. I do think that visualizing how much the ranges overlap is useful though.
Based on seeing the “graduates” of our early school leavers programme turning up in the court pages of the local paper, I’d say that IQ by itself isn’t the only predictor.
Yes, if you have lower IQ you’ll struggle in school, get lower qualifications, and be confined to the type of manual and unskilled/semi-skilled work that is being phased out. Service industries are taking over from manufacturing industries and they don’t pay as well.
On the other hand, as you point out, lower IQ does not mean “will become a criminal”. There’s a certain level of intelligence necessary for crime as for anything else.
What does count as contributing factors on top of, or beside, less academic/lower IQ? Well, let’s see:
Drugs. This is why I’m “not just no but HELL NO” when it comes to the perennial question of legalising drugs. Yes, even weed. The guys outside at break time sparking up are the ones who’ll wash out of the programme and fall back into petty crime. The girls will go on to develop a nice little heroin habit, have kids that will be taken into care as they’re deemed unfit mothers, have a string of convictions behind them and be looking at doing solid jail time by the time they hit 25 (to take two examples I personally know).
Being easily led, in conjunction with what used to be called bad company or bad companionship. It sounds laughably Victorian but it’s one of those “Gods of the copybook headings” things. Especially when we’ve been quoted studies about how parental influence has little to do with how kids turn out or the development of their characters, hanging around (particularly when you’re the vulnerable one of the group) with guys who are involved with petty crime will lead to you being dragged into that, and probably being used as the catspaw by the smarter ones. Again, personal experience of that: 16 year old boy at the school where I worked, severe learning difficulties and was of low IQ, only child of elderly parents who, now that he was growing up and getting bigger and stronger, couldn’t control him and he didn’t want to be controlled; they were worried because he suddenly had a lot of money that there was no way of accounting for (they weren’t giving it to him and he didn’t have a job so he wasn’t earning it); suspicion that he was involved in crime and being used by so-called “friends” as the one to take the blame if the cops caught up to them.
Parents and family: is there such a thing? Again, broken homes, single parenting, lack of support, unemployment, no engagement with education, so on so on and so forth. If there’s no support at home, it’s easier to drift into crime, especially when you have a group of buddies urging you on (see above re: bad company)
Employment: when the times were going good, there was plenty of work in areas such as construction, so apprenticeships were there for the more able and even the less able could get some kind of manual/unskilled work. When that goes, as in the current climate (though it’s starting to pick up again), it’s life on the dole and again, the temptations of petty crime.
You are confusing the problems caused by drugs with those caused by prohibition of drugs.
A person getting addicted to a drug is most likely due to the person+drug combination, I include the person because they made the choice to take it the first time, and there is a good chance that they have an addictive personality in the first place.
A person going to jail and having a “string of convictions behind them” is caused by making drugs illegal. People go to prison for drugs either because 1. They got caught with drugs on them. 2. They stole money or goods to fuel their habit. or 3. The drug made them go bonkers and they attack someone.
#1 is obviously a direct consequence of prohibition, no need to go into any detail.
#2 is indirectly caused by prohibition: drugs have to be sold on the black market, which results in higher prices, lower quality, unreliable concentration, poisonous dilutionts, super-concentrations (yes, that does happen at the same time as lower quality), linkage to the criminal underworld, and funding of criminals. On the free market these problems disappear rapidly.
3. depends on the specific drug, but is exacerbated by prohibition because there are advantages to the dealers in drugs that have higher concentrations, which they can dilute with drain-o or rat posion. Or alternatively develop a new drug that is cheaper than one of the “staples”, for one of the recent examples see krokodil as a heroin substitute.
None of this makes taking drugs a good idea, but the confusion of causes is common among anti-drug peddlers: it is their equivalent of the pro-drugist’s “MARIJUANA CURES ALL DISEASES!!!111one!!” spewage.
Even if drugs were legal, the convictions result from more than just “going bonkers” in the running amok sense. Assume legal and not too-heavily-taxed drugs:
1. Typical heavy pot smoker has almost no ambition, and therefore doesn’t have a job nor much money. He wants something, and rousts himself to do something about that want. The easy route, at that point, is probably something criminal – steal the item directly, or steal money to buy the item.
2. Drugged driving.
3. Impaired judgment from too much drug use leads to over-reaction to some slight, or some other violation of another person – starting fights, groping women, etc.
Is that really true of a typical pot smoker? I’ve known quite a few and just my bare system 1 pattern recognition tells me there was no relationship at all between whether or not they smoked and how much ambition they had. I’m pretty sure the last three Presidents of the U.S. all smoked it at some point.
Adam – for heavy pot smokers, my experience is that loss of ambition is very typical. For occasional pot smokers, much less so.
In my experience heavy pot usage is correlated with low ambition, but in fact low ambition and motivation encourages smoking, rather than the other way around.
Anthony: perhaps you go the causation reversed?
@ Foo Quuxman
You are confusing the problems caused by drugs with those caused by prohibition of drugs.
I agree that quite a few of the problems mentioned in this thread are caused, or made catastropic to the user, by the illegality. Legal booze has similar physical effects, but not the indirect (ie legal) effects except in extreme cases.
I checked, and in Denmark in the sixties (when all the men studied in this study would have committed their crimes) drugs were legal to own and legal to use. Only production and possession of large amounts with intents to sell was illegal.
Yet they had a crime spike in the sixties, like everywhere(?) else. With the age and gender demographics of crime, the demographic studied in this study would have had to stood for most of it.
No, a person getting a string of drug-related convictions is not due to “oh, drugs possession is illegal”. Conflating the two cases I know, it’s due to multiple offences of shoplifting and similar petty crime to get money to feed her habit, getting into fights, public drunkenness, public being under the influence of prohibited substances, stabbing another person in the stomach at a party when probably everyone there was pretty much drunk, stoned or both, and generally being such a public nuisance due to anti-social behaviour that they get constantly moved around from housing estate to housing estate because of complaints from the neighbours, on top of generally being unable to sort their lives out.
If the only objection to legalising soft drugs (though I don’t know how much difference such a division between ‘soft’ and ‘hard’ drugs makes) was the simple fact of possession making you a criminal, then I’d probably say sure, go ahead and legalise them.
Seeing the effects of drug use is a different matter. Even petty drug-dealing and suppliers on a small scale are a complete pain in the arse when they hang around a house on a council housing estate, much less get established in one. Things go very downhill from there.
Maybe you and others you know can recreationally consume and still manage not to spend every spare penny on your habit, get up and go to work, get a job and/or education in the first place – good for you.
But making it legal is just making it easier for people to wreck their lives – and yes, I’ll anticipate you here, people do have the right to wreck their lives. But then society is left to pick up the pieces, and a lot of the people who are gung-ho for legalisation are not the ones dealing with the fallout and who would be the first on the phone to complain to the council and the police over a drugdealer living next door to them and all the crime and chaos that attracts.
If drugs were legal, they wouldn’t need to shoplift and commit other petty crimes to buy drugs, because drugs would be sold on the free market. How many times do you hear about someone committing petty crime in order to afford cigarettes?
And some of the things you mention either aren’t related to drugs at all, or are related to alcohol, which is legal. You don’t seriously think soft drugs like marijuana make people get into fights, do you? But alcohol does.
“Yet they had a crime spike in the sixties, like everywhere(?) else.”
Didn’t Scott make a post about the relationship between lead and crime? Isn’t the 50s-60s around the time period that lots of people with cars + leaded gasoline started becoming ubiquitous?
alexp and anonymous, at least two cases I know of, the causation ran the direction: start smoking pot heavily, lose one’s ambition for almost anything other than getting stoned again.
Jiro – “If drugs were legal, they wouldn’t need to shoplift and commit other petty crimes to buy drugs, because drugs would be sold on the free market.”
It doesn’t matter how cheap they are, if you have no job, they’ll be too expensive to afford without resorting to petty crime. If being a heavy tobacco smoker was incompatible with keeping a job, you’d see a lot more crime related to tobacco. (And you do see a lot of petty crime from the worst alcoholics – the ones who can’t wait until quitting time to crack open a beer.)
Anthony, would you say the same thing of videogames?
Some of the best videogames are free, but in fact you do see videogame addicts engage in petty theft in the form of piracy quite often.
I don’t like the analogy. First, I have no reason to think that “addicts” are more likely to pirate games (so that addiction would cause piracy). Second, be one pro or anti online piracy, “theft” is a box where it seriously doesn’t fit.
But anyway, my point is that the reasons Anthony stated for believing that marijuana causes loss of ambition are apparently also observed with video games (I don’t think those are very good reasons).
Cauê, if someone is such a videogame “addict” that they can’t hold down a job, and don’t really care about that, I expect that they will also be more likely to commit petty crimes to feed themselves and their addiction.
How do you know?
I regret to say that I have never been to Ireland. However, I have done historical work on populations that include a lot of Irish-American people. And one frustration with this data is just how few Irish-Catholic names there seem to be.
Given a piece of historical data about an individual in Boston named (say) Joseph Murphy, or Patrick O’Malley, without more detail, you actually know very little, because in a city like Boston at the time, there were probably hundreds of Irish-American men with those exact names.
Of course name duplication can defy the odds. Michigan State University used to have two completely unrelated professors, both named “Charles R. St. Clair”.
But in a context where there is only a relative handful of surnames, and only a few culturally acceptable given names, name duplication would seem to be a constant headache.
For a sense of scale, there are 100k Irish in Boston proper today. There were a lot more 50 years ago. There are about 100k in the average Irish county.
We must not forget the effects that the devil jazz will cause the kids to dance in a wild frenzy that will cause them to be overtaken by an insatiable desire to have unprotected conjugation. All forms of fun should be strictly prohibited based on my definition of: all, forms, of, fun, should, be, strictly, prohibited.
Except that these things are happening with prohibition, as opposed to without it.
Do you predict WA and Colorado to suddenly get way worse on the fronts you mentionted? (You seem to be baselessly predicting they will.)
I would bet for the opposite effect.
I predict there will be little change in Colorado and Washington because pot was, like in California, already pretty much legal.
There’s a myth that there are lots of people in jail merely for drug possession. In the U.S., this is pretty much completely false relative to marijuana, and even generally untrue with respect to harder drugs. Occasionally, the only charge is the drug charge, but that’s because the cops arrested the person for some behavior which might be hard to get a conviction for, or which might rate more of a sentence than is really appropriate, but they know they can make the possession stick, and the penalty won’t be too awful.
Danish men born at the end of World War II, assuming they have conscription tests at age 16 like in Norway, were tested in the early sixties, and were at peak age for criminal activity in the late sixties. The age of accountability in Denmark is 15, and I believe it was that in the sixties also.
Crime increased in the sixties, but it almost certainly wasn’t drug crimes – they didn’t even start tracking that until the mid-seventies. Nor was it sexual offenses. Thanks to liberalization, fewer people were convicted of that than earlier. It was apparently property crimes, including car theft and robberies, that stood for most of the increase in crime.
Since the study asked about two or more crimes committed before the age of 20, that means you’re talking about people getting caught and convicted for at least two crimes in just four years – most likely property crimes. At that point, Denmark being Denmark in the sixties, you’re a very troubled kid. So criminality predicts low IQ? Big whoop, I bet any Danish police officer could spot these kids a mile away. They would be the ones having the full basket of issues.
What I would be a lot more interested in was stuff like lead as a confounder here. Looking for something like that, that you might actually be able to do something about, is a lot better than attempting to identify criminals by the correlation to performance on Raven’s progressive matrices.
The testing age is 18 for conscription (forsvarets dag/sessionsprøven).
Also particularly beware comparisons in “predicted variance” for different populations, since this will change with the population variance for predictions that are equally “good” (e.g. in terms of standard error of estimate). Similarly for regression on conditional distributions. Similarly for comparisons between entirely different statistical problems.
While I’m here, I’ll disagree with (or at least second requests for clarification on) “it’s perfectly consistent with IQ being a very strong predictive factor” in the first case and “describing it as ‘only predicting 16% of the variation’ seems patently unfair” in the second.
For 1, in what sense is IQ a strong predictive factor? At best I’d say crime is a predictor of IQ in that model. Knowing someone’s IQ, you’re barely more likely to be right about their criminality than I, in total ignorance, am.
For 2, I’m also not sure what you’re getting at. Speaking extremely roughly, all variation independent of IQ appears to be five times as important as IQ-correlated variation for describing that population. There also happens to be a lot of variation. Could you elaborate on why you feel it’s wrong to describe it that way? Is it enough to include both relative and absolute measures of “predicted variance”?
One of the interesting things about IQ is that while, as you point out, low IQ is by itself only very weakly predictive of criminality, it amplifies other risk factors. Like: growing up fatherless. Or having a history of drug or alcohol addiction, or having other markers of .high time preference / low impulse control. Or just growing up in a trash culture that glorifies the thug life. Combine any of those factors with low IQ and you get a probability of criminal record that goes way, way up relative to IQ alone or any other individual factor alone.
No source for this, sorry. It’s a pattern I’ve noticed in violent-crime offenders while studying the criminological issues around firearms regulation.
That maps pretty well onto my intuition. (Or should I say, my intuition maps to that explanation pretty well?)
I’m hesitant to try to come up with any policy suggestions based on that (especially not without some sources) but it seems like it’s a potentially Very Important Factor.
This is completely orthogonal to the question.
You are substituting your intuition for data.
I agree that I have no data.
I was trying to say ESRs conjecture seems intuitively correct to me and thus I really wish I had some actual data.
Well, in the first example, on the Invented Data graph, if I knew someone had higher than average IQ, I could be certain they were not a criminal. That sounds like pretty high predictive power, in a fuzzy vague sense, to me.
Alright. That seems like an artifact of how certainty turns up in the model, since in real life, you just have different but still very small probabilities. Maybe something like “relative risk” would be better suited to talking about that, although that has similar problems as a summary statistic.
Well, let’s assume there’s only two factors to criminality, Dumb-ass and Ass-hole. You need both factors to become a convicted criminal. If you’re a dumbass but not an asshole you are harmless. If you’re an asshole and not a dumbass you become a politician or a pushy salesman or something else where your total lack of ethics is a competitive advantage without the huge downside risk of jail time. People who are sufficiently dumbass to be criminals are way more common than people who are sufficiently assholes, so that’s by far the dominant factor.
That means that all the concepts attached to criminal other than breaking the law are overwhelmingly asshole traits. This suggests that when people can see what the smart assholes are doing, they will want to criminalize it and will have a tendency to call them criminals even if the current body of law doesn’t cover that activity.
Heh. That’s pretty good.
The other thing your dumbass/asshole generative model suggests is that if you can figure out any way to do it, concentrating your police resources on stupid people is efficient.
Unfortunately, given the population statistics, that smart move is immediately going to land you in a racial-politics quagmire.
It’s entirely possible that at least part of the reason for the predictive power of IQ on arrest history in the first place is already police concentrating their resources on stupid people.
Maybe, maybe not, but at bare minimum, “arrest history” is a very imperfect proxy for criminality. Probably a decent proxy for public displays of violence, though.
Also: it’s easy to show that if you have two factors, one relatively common and one relatively rare, both needed to cause a particular outcome, then the common one must only explain a small fraction of the variation[1].
Consider a scenario where you need low IQ (call it factor A) and 6 equally common factors (call them B, C, D etc.) to make a criminal – so you need A&B&C&D&E&F&G. So A should explain a smallish fraction of the variation, being one factor among seven. The conjunction of B&C&D&E&F&G is pretty rare, rarer than A, and (A)&(B&C&D&E&F&G) is a necessary and sufficient condition for a criminal. Now consider again a two-factor model, factors A and X, where A&X is necessary and sufficient, and X is as common as B&C&D&E&F&G is – the fraction of the variation for A shouldn’t be different here. Therefore if you have a common factor and a rare factor, jointly necessary for some outcome, then the common factor will have low r or R2 values.
[1] The trouble with things like r is that people talk about fractions of the variance, and variance is weird, in that it tends to be the square of what you were really interested in.
But you could be very certain they were a criminal even if you didn’t know their IQ. Almost no one is a criminal in that made up data.
And we don’t know for sure that made up data is accurate. Without the actual data, you don’t know what is happening- lots of data patterns will lead to the same sort of summary statistics.
Scott, the made up data seems highly predictive of non-criminality for one subset. But knowing someone is below average intelligence doesn’t help very much at all in predicting whether they will be a criminal or not.
And of course, the actual data doesn’t look like that, as there intelligent people who commit crimes. So you wouldn’t even be able to subset it.
if I knew someone had higher than average IQ, I could be certain they were not a criminal
No. You can’t be CERTAIN. You can think or have a very high confidence or predict they are not LIKELY to be a criminal, but you cannot say “HIGH IQ = NOT NEVER NOHOW CRIMINAL”.
Or how do you explain all the white-collar crime and the highfliers who pretty much ruined the country with speculation?
The likes of Bernie Madoff show that wanting to believe even when something sounds too good to be true over-rides a lot of good sense. The same way the Nigerian email scams in their early days appealed to people who should have had some kind of business integrity but didn’t or couldn’t resist the lure of easy money, even if it involved screwing over the people and government of an African nation.
Running the risk of being insensitive, what about Dr Harold Shipman? Doctors are presumably reasonably intelligent; this site estimates physicians to have an average IQ of 160.
Certainly not every doctor is a serial killer! But if you assumed “doctor = higher IQ” and from that pronounced “I can be certain this person is not a criminal”, you would have been badly wrong in that case (and indeed, the aura of respectability and trustworthiness around the medical profession probably helped to deflect suspicion for a long time).
Indeed, when you delete half of a sentence, sometimes the other half doesn’t make sense by itself.
He’s talking about the invented data, not reality. Of course reality includes high-IQ criminals.
Physician average IQ is not remotely close to 160. If you read that link it makes no attempt to determine the IQ of different professions, it just looks at their average income and then maps that to modeled relationship between average IQ and income (which is highly inaccurate at high incomes). As you can see, that results in surgeons having an IQ of 230 which not even one person in the entire world has. Similar absurd results would be evident for any high-income job.
You really seem to have a pattern of misrepresenting what other people have said.
If you’re inventing data, you have to have some reason for why you put what you put where you put it.
If your initial assumption is that “leprechauns repair shoes”, then you can invent data about “number of pairs of shoes worn out in the last fifty years” and see that people tend not to bring their shoes for repair when they wear out but instead buy new shoes.
You can then extrapolate from that “The trend for not getting shoes repaired is caused by a decline in the leprechaun population.”
If I assume “high IQ means not a criminal”, of course I’m not going to put my imaginary criminals on the high IQ end of my invented scale. That still does not mean that my invented data has any relation to actual reality.
If I’m making up my data, I don’t get to make pronouncements about what IQ does and does not permit me to say with certainty.
Deiseach, you’re going the road of this guy here.
Scott had some invented data someone came up with that has a low R**2 value but in which IQ appears to be, conversationally speaking, a good predictor of crime, because nobody with above-average IQ in the dataset is a criminal. The invented data is specifically to highlight that you can have this situation where R**2 is low but a variable seems usefully predictive, the thing that this blog post is about. I’m not sure it’s necessarily intended to be reflective of the real world.
Deiseach, that is a total mess of a post. When someone mentions to you that you seem to have serious communication problems, it really doesn’t help to post a non sequitur about leprechauns.
As best as I can figure out, you post:
Asserts that if one wishes to explain X, and decides to analogize it to Y, one needs a specific reason for choosing Y; one cannot simply say “My point is really clear in the case of Y”.
Includes an analogy involving leprechauns for no discernible reasons.
Hypotheticals are chosen for their illustrative power, not for how well they comport with reality. If they were perfectly based in reality, they wouldn’t be hypohteticals. If you don’t understand basic concepts such as “hypothetical”, perhaps you should find a less intellectual place to spend your time.
I haven’t bothered to click through that link, but that number is impossibly high. 160 is +4 SD, or roughly 1 in 10,000; even if every individual of that IQ went into medicine, which they don’t, there are still only about 30,000 people with that kind of IQ in the US. Google tells me that there are in fact about a million doctors in America. (America selected because it’s intuitive to me; analogous figures should exist for Ireland or wherever.)
Now, some of them are immigrants, which would bugger up the numbers since there’s some selection going on there; but even if every person in the world with 160 IQ got an MD and moved to the States, there wouldn’t be enough of them. If we ignore that selection effect, on the other hand, doctors’ average IQ can be no more than 140. By comparison with the figures I’ve seen for students in other technical fields, I’d personally estimate somewhere more in the neighborhood of 130 and maybe lower.
FWIW doctors per capita is about the same in America and France.
You really should click through to that link.
Now I have. Yeah, the estimate for doctors is bunk, and the reason given by someone above me is correct (viz. the model goes to hell at higher salaries).
It would be more interesting if it gave us both modeled and actual IQ, which would give us a sense of what proportion of salary for a given job comes from intelligence (and thus scarcity of candidates) vs. other factors. But finding that data would likely be hard, and if we had it we’d be able to generate the inverse figures (salary predicted from average IQ vs. actual salary), which attack that issue more directly.
With a correlation of -.19 … if someone has an IQ that’s 1 SD higher than average, his expected number of crimes would be 0.19 SD lower than average.
That works out to 0.066 fewer crimes than average per 15 IQ points.
The only reason you can be “certain” the high IQ person isn’t criminal is that in this particular made-up example, the data just happens to have zero high-IQ criminals. That doesn’t have to be the case.
If you took an infinity of possible dataplots of IQ/crimes, all with correlation -.19, and the same mean and variance of IQ and criminal acts, you’d find that the 0.066 fewer crimes per SD works out, on average. It’s just that this particular plot isn’t very linear.
Another way to think about it: the correlation coefficient gives you information only about what you can infer about average criminality for a given IQ, based on a “randomly chosen” IQ. That’s perfectly consistent with “I can infer a lot from a high IQ, but I can infer a lot less from a low IQ.” The “average,” in some sense, is -0.19.
When that happens, by the way, it’s a sign that you’re doing a linear regression for a dataset that really isn’t a straight-line relationship.
Sure, but that’s a totally different probability. p(law-abiding|high IQ) is 1. That’s not fuzzy or vague, you’re totally right that it is highly (indeed, perfectly) predictive. Of course, p(law-abiding|high IQ) tells you very little about p(criminal|low IQ), except that it must be greater than p(criminal).
This is a more general problem: p(A|B) is typically not the same as p(not A|not B). I suspect that this is a common fallacy because it is similar to a perfectly valid *logical* inference: “if A, then B” is logically equivalent to “if not B, then not A”. But even the logical relationship doesn’t apply to statistics: p(A|B) is not the same as p(not B|not A). Illustration:
Five people with traits A or -A and B or -B:
(A,-B);(A,-B);(A,-B);(A,B);(-A,B)
P(A) = .8
P(B) = .4
P(A|B) = .5
P(B|A) = .25
P(-B|-A) = 0
Sorry to belabor this point, but I actually thought P(A|B) = P(not B|not A), and I was surprised when I proved the opposite. Anyway, modus tollens is a lie and I will never understand anything.
Learning they have high IQ doesn’t improve your guess of criminality much, in the sense of squared error.
Suppose they’re high IQ and not a criminal. You learn they’re high IQ, and your estimate of number of crimes committed goes from .001 to 0.
Correlation is about improvement in prediction (when the only way you’re allowed to use what you learn is a linear model)
Depends what you mean by “crime”; whether you mean something analogous to “IQ” or “high IQ”. If, in the invented data, I know that someone is a criminal, that tells me a lot about their IQ. If I know whether or not someone is a criminal, that on average tells me little about their IQ, because chances are they aren’t a criminal, and knowing that someone isn’t a criminal tells you very little about their IQ.
The way I explained it on my blog a few years ago:
The correlation (or r-squared) doesn’t tell you the effect of IQ on salary. It tells you the importance of IQ to salary *relative to everything else that’s important to salary*. Like age, education, location, work habits, sex, and so on. In that light, “16% of the variation” is A LOT.
If you want to know the effect of IQ on salary, look at the regression equation. It probably looks like
SALARY = $30000 + $15,000 * (IQ Decile)
Which answers the question you really want answered. Notice that the equation, alone like that, doesn’t tell you anything about the r-squared or correlation. You could invent datasets with any r-squared you wanted, but still $15,000 per decile.
The analogy I used: suicide. Suicide explains only a small portion of the variation in lifespan, because only around .0001 of the population dies of it each year. But the effect of suicide on lifespan is, obviously, very high! In other words, with made up numbers,
Lifespan = 70 – 40 * (suicide dummy variable)
r-squared = .01
Here’s the link.
Part of the problem is the real equation is more like:
SALARY = 30000 + 15000 * (IQ Decile) + N(0, 30000)
It’s a strong positive relationship, but still a lot of residual uncertainty. The low r-squared value isn’t telling you much about the importance of the variable in question. It’s telling you a single-variable model is a very poor fit.
On a slight tangent, I went to the NLSY79 dataset to see if I could come up with a better example pulling a few variables, but since they measured thousands of things and won’t give you a complete dataset but require a convoluted web search to find what you want, I gave up. Nowhere in the “achievement tests” section was there an IQ test, though. All they had was the ASVAB. I don’t know if things were different in the 70s, but when I was in school, people who planned to go to college didn’t take the ASVAB. In fact, I was actually in the Army and never took the ASVAB, because commissioned officers aren’t required to take it. We’re assigned a job based on GPA, physical fitness, and leadership evaluations from our pre-commissioning program.
This book is essentially all about this topic and a good read too.
re: IQ & crime – the real conclusion you can draw is that IQ is a rough proxy for “reasonably bright with not overly awful upbringing” which implies “very probably not a criminal in the usual sense.”
In other words – not so much that low IQ causes crime, but that higher IQ prevents it.
A similar thing applies to poverty and crime – it’s not “povery causes crime” but more “non-povery prevents crime” – as in, if you have a reasonable social-economic status, you have much better things to do than be a criminal.
re: Salary – related to what Phil said, but note that the higher up you get, the *wider* the variance. Because really bright people may retire early, or live on savings or investments while reporting low or no income, or marry other bright people and stay home with the kids, or have an exotic idea about how to live very very cheaply on a farm somewhere, and thus have very high utility standard of living at low cost.
The real implication is “higher IQ means less likely to be stuck in a life long dead end grind”
Yeah, probably that: the higher your IQ, the more choices you have, the more options, the more things are open to you.
Note that “Lies, damned lies and statistics” does not refer to a technical problem with statistics as a field, but rather to the subtlety of correctly interpreting statistical-technical jargon.
Always plot your data!
That’s the first question in my IQ FAQ:
Q. Is IQ really all that important in understanding how the world works?
A. In an absolute sense, no. Human behavior is incredibly complicated, and no single factor explains more than a small fraction of it.
In a relative sense, yes. Compared to all the countless other factors that influence the human world, IQ ranks up near the top of the list.
http://www.vdare.com/articles/why-do-we-keep-writing-about-intelligence-an-iq-faq
Phil (above) is right, I think. This back-and-forth just published reflects a similar issue and so might give another way to think about it outside of the IQ stuff.
Essentially, the Original reported a large difference in momentary happiness depending on whether a (self-rated) moral or immoral event happened. The Critique shows that, at the same time, moral and moral events predicts a small amount of variance in momentary happiness. The Response points out that both descriptions of the data are accurate, but they are asking different questions.
In short, people do really seem happier following moral events than immoral events, but moral events only predict a small part of the variation in happiness over the course of the day. Lots of things predict happiness and moral events is one part of that.
Original: http://www.sciencemag.org/content/345/6202/1340.abstract
Critique: http://www.sciencemag.org/content/348/6236/767.1.abstract
Response: http://www.sciencemag.org/content/348/6236/767.2.abstract
To bring it back to IQ and Crime: People who commit crimes on average have lower IQ, but given the noise in both of these measures, plus the many other things that are associated with both IQ and Crime (from genetics, to upbringing, to specific circumstances at moment of the crime etc), IQ only explains a small variance in crime. As Phil illustrates, the same could be said about income and IQ or lifespan and suicide.
Pingback: 1p – Beware Summary Statistics | Exploding Ads
The correlation you report is not the correlation between IQ and committing crimes; it is the correlation between IQ and getting caught for committing crimes.
An important distinction, no?
Correct. This is particularly relevant because the evidence at the JRank link says low verbal intelligence seems to be more strongly correlated with crime than low other types of intelligence.
Much investigative work continues to be about interrogation, and this is more true the further back you go, to before DNA testing, cellphone location tracking etc. became available. And verbal intelligence is exactly what you need to lie convincingly to people who have a lot of practice at detecting dishonesty.
I’m not convinced by the usefulness of “crime” as a catch-all category anyway. My idea is that there are two kinds of crimes. One is those that criminals don’t really try to escape investigation for, because what they’re doing is super obvious or they’re drunk or they just don’t think about it. These are bar fights, kids stealing cars, liquor violations and the like. This is what I think higher-IQ people generally don’t do. But what about more careful crimes like insurance fraud, corruption or violations of professional duties? Anything a criminal has planned to get away with, by careful plotting and actively avoiding or destroying evidence, is its own kind of crime I think. We don’t know that higher-IQ people really don’t do that a lot. We only know that either they don’t or police are quite bad at catching them.
It is pretty difficult to violate professional duties below the age of 20.
to be even more precise, it’s the correlation between IQ and being convicted of a crime.
Pingback: 1p – Beware Summary Statistics | Profit Goals
I was used to interpret the correlation r through the equation
b=r*(s_x/s_y)
Where b is the slope and s_x / s_y are the empirical deviations of the data. (I’ll be more careful now, after looking at the anscomebe quartet).
But can anybody please explain (preferably with equations) how to understand (or derive from the definition of r) the phrase “r=??? means x explains ???% of the Variance in y”
In response to amazing_MuhKuh’s question:
Given a set of pairs (X,Y) (normalised by subtracting out out the means of both), one can fit a model X = bY + E by least squares optimisation, and b will be as you described. The variances of X, Y, and E will be related by var(X) = b^2 var(Y) + var(E). That is, the variance of X decomposes into two parts, that “due to” Y and that “due to” E.
There’s a reason I’m using the scare quotes, which I’ll come back to.
The proportion of var(X) that is “explained by” Y is then b^2 var(Y)/var(X). Since var(X) = s_x^2, this simplifies to r^2. Thus given a correlation of r, one often says that Y “explains” a proportion r^2 of the variance of X.
Given any set of pairs (X,Y), one can mechanically compute r and fit the model X = bY + E. However, if Y and E are not independent (as in the examples of Anscombe’s quartet), this interpretation of r^2 is no longer valid. X might be uniquely and precisely determined by Y, even when r=0.
One can just as easily fit a model Y = aX + E, where a = r*(s_y/s_x), and say that X “explains” r^2 of the variation in Y. This line is different from the previous one unless r=1. The previous line with the axes swapped would have slope (s_y/s_x)/r.
Now for those scare quotes.
“Noise.” In statistics this means “unmodelled variation”: everything else, whatever it might be, that makes Y less than a perfect predictor of X, lumped into the unobservable variable E.
“Due to,” “explained by.” When dealing with observational data (you look and gather pairs (X,Y)), as opposed to interventional data (you force Y to a particular value and see what you observe for X), these have to be understood as terms of art which do not mean a causal relationship or an explanation, unlike the everyday meaning of those words. The variance in X “due to” or “explained by” Y is nothing other than the proportion that was calculated above. Both sets of data described in the top post are observational.
“Predicted by” might be better than “due to” and “explained by”, but the terminology is what it is. (Even “predicted by” is not satisfactory, as the “prediction” may not replicate on new data.)
When one has, from whatever source, causal information about the relation between X and Y, saying that Y has a causal influence upon X and not vice versa, and that E (whatever it is) is causally independent from Y, then “due to” and “explained by” are closer to their everyday meanings.
If you compute the variance of the residuals from the regression line, this variance will smaller than the variance of the original y values; the fractional reduction is r^2.
To derive this, consider the simplest case where X and Y have mean 0 and variance 1. Then the correlation coefficient is r=covar(Y,X)
Now we ask about the variance of the residuals, var(Y-rX). We have
var(Y-rX)
= var(Y) + var(rX) – 2 covar(Y,rX)
= var(Y) + r^2 var(X) – 2 r covar(Y,X)
= 1 + r^2 – 2 r^2
= 1 – r^2
compared to var(Y) = 1, we see that the variance of the residuals is reduced by a fraction r^2 compared to the variance of Y.
This is, by the way, why it’s very important to visualize data, scatterplots being of among the most important.
Scatterplots are wonderful things, and its amazing how they are able to demolish even the most subtle statistical sleight of hand. But you can’t always make a scatterplot. When you are dealing with highly multidimensional data sets with non-linear effects, you have to rely on statistics. Which is why epidemiology (among many things) is hard.
Pingback: Interesting Links for 20-05-2015 | Made from Truth and Lies
1) I’m not a data guy, but is there a convienient way to graph the distribution within each IQ decile on your income bar graphs? For example, maybe a color where the color gets more transparent the fewer people found at that level in that decile, or a diamond instead of a bar where the width of the diamond at any point indicates the number of people at that point? (Or both?) If I’m right, that would show you the variance within the deciles and maybe clarify some of it.
2) I think Steve Sailer has an interesting way of looking at it upthread. It’s possible that (1) IQ doesn’t tell you very much when compared to everything else in the universe but (2) IQ is still the most predictive single factor, or one of the most. (That can be gamed, though, depending on how you group together or split “factors” when you’re defining them).
This is a good idea, and the answer is “yes”. The first way that comes to mind is a box-and-whisker plot for each decile.
(I’m the pappubahry who made the graphs in this post, and I’d make this example as well, but the computer I’m on is having issues installing some software I need at the moment… maybe tomorrow.)
library(ggplot2)

library(ggthemes)
iq <- rnorm(1000, mean=100, sd=15)
normed <- (iq - mean(iq)) / sd(iq)
income <- rep(30000, 1000) + rep(15000, 1000) * normed +
rnorm(1000, mean=0, sd=30000)
df <- data.frame(income=income, iq=iq,
dec=cut(iq, unique(quantile(iq, seq(0, 1, 0.1))),
include.lowest=TRUE))
g1 <- ggplot(aes(iq, income), data=df) + geom_point() + geom_smooth(method="lm") +
theme_few()
g1
g2 <- ggplot(aes(dec, income), data=df) + geom_boxplot() + theme_few()
g2
Gives you these:
plot1
plot2
Probably more informative than the simple bar chart.
That is called a violin plot. They’re great if you really want to see everything, but for purposes like this, it is probably better use the box and whiskers to display the summary statistics for the distribution in the decile. The violin plot is a good check to see if the box and whiskers is misleading because the distribution is weird (eg, bimodal).
Thanks everybody!
One rule about correlation that’s helpful for me:
In a linear regression, correlation (r) is the conversion rate between standard deviations of the two variables.
That is, linear regression predicts that, when x is c standard deviations above x_mean, y is r * c standard deviations above y_mean on average.
(Similarly the opposite regression predicts that when y is c standard deviations above y_mean, x is r * c standard deviations above x_mean on average.)
Applying this to the first paper: “The men who committed two or more criminal offenses by age twenty had IQ scores on average a full standard deviation below nonoffenders”
Maybe >=two criminal offenses before age twenty is 2.0 standard deviations above average? So variable x at +2.0 standard deviations implies y is -1 stdev. This would imply correlation = -1 / +2.0 = -0.5. You’re right to think -.19 sounds weak given this fact. My guess is that the relationship is quite a bit weaker in the rest of the data because no one can have negative criminal offenses. (Maybe a non-linear fit would be better?)
In the second case, consider a linear model with constant a0 and uncorrelated factors each normalized to mean 0:
income = a0 + a1 * iq + a2 * factor2 + a3 * factor3 …
The bar graph is showing something like the values of a0 + (a1 * iq) for different deciles of iq.
As you point out, these bars vary a lot. To be specific: stdev(a0 + a1*iq) is rather large as a fraction of stdev(income).
a0 is constant so stdev(a0 + a1*iq) = stdev(a1 * iq).
Related to the correlation rule in the first comment there’s another fact that stdev(a1 * iq) = r * stdev(income) where r is the correlation. Here r = 0.4, so it makes sense for stdev(a0 + a1*iq) to be a decent fraction of stdev(income).
The bar graph makes sense given the correlation number.
But if the bar graph values are varying 40% as much as income itself, why isn’t the predictor explaining 40% of the variance? Wouldn’t combining two such predictors and making the same graph give values that vary 80% as much as income?
Well no, and for the same reason adding two (uncorrelated) normal distributions of stdev 0.4 doesn’t give a normal distribution of stdev 0.8, it gives a normal distribution of stdev 0.57. And it takes six such distributions to reach a normal distribution of stdev ~ 1. For me that core fact is the hardest part to internalize.
In short I don’t think you need to be so hard on summary statistics here!
In the first case, the authors show a strong relationship between two variables in a subset of the domain, which doesn’t contradict a smaller correlation over the full set. And the bar graph from the second case is like what we’d expect from two variables with that correlation.
I find r-squared values to be virtually useless for that exact question. The real question you’re asking is “How statistically significant is the slope of the regression?” There are p-value tests for slopes (and intercepts), confidence intervals for them, etc. they are just harder to calculate.
I’m not exactly sure off the top of my head if the same formulas generalize to non-linear regressions or not.
For the first graph, it helps me to think of it like cancer screening tests – a low base rate means that even something highly predictive will be wrong most of the time.
I’m not sure how to apply this intuition to the second case though.
The intuitive explanation of the second case is that, although IQ explains more of the variability in income than any other easily measurable single variable, no single variable explains more than a small amount of variation in income. This would give it a high p-value as a predictor, but a model with only this predictor would have a very low r-squared value.
The term we should really be using for IQ is “significant.” Whether or not it’s predictive depends on what you’re trying to predict. Give me two groups of 1000 people each, one with a mean IQ of 90 and one with a mean IQ of 120, and I can probably accurately predict the difference between their mean incomes. Randomly select any two individuals with IQs of 90 and 120 and I’m not going to be so accurate.
Regardless of the amount of variance, going from a category where I can expect to make on average $40,000 to a category where I could expect to make on average $160,000 seems like a pretty big deal, and describing it as “only predicting 16% of the variation” seems patently unfair.
Important, recurring point – a lot of these summary statistics are about the whole population, rather than particular bits of it. The extremes might be quite different, but most people by definition aren’t in the top or bottom decile, so that difference only makes a small contribution to the overall pattern of variation.
In my particular field, there’s “mutual information” which is very much a whole-population thing, and “pointwise mutual information” which zeroes in on the particular phenomena of interest. For example, for documents, is there a correlation between containing one particular word and containing another? Compare “this” and “that” with “higgledy” and “piggledy”; the former pair is likely to have relatively high mutual information and relatively low pointwise mutual information; the latter pair is likely to have relatively high pointwise mutual information but relatively low mutual information. Knowing whether a document contains “higgledy” doesn’t on average tell you much because chances are it doesn’t contain it and you could have guessed that anyway – knowing that a document does contain “higgledy” tells you quite a lot.
Just as an example, if you take the same data I simulated above, the r-squared value of a model including the entire population of income predicted by normed IQ is 0.2086. If you subset to only the lowest and highest deciles, the r-squared value is 0.451.
Fit a regression model to the data and look at the coefficient for IQ. That directly addresses the question “How important is IQ in influencing X?” (Yes, you still have the question of whether it’s a causal or merely inferential relationship.)
This post was interesting enough that I had to replicate the math. To simulate IQ, I used N(100, 15). To simulate income, I used MAX(N(-20+1.2*IQ, 70), 0). A little more realistically, I could have done something with income as log normal, but this was sufficient to replicate the charts.
Anyway, I took one iteration of this simulation and regressed the income on IQ. The results of the regression show that IQ was highly significant. By just about any sensible evaluation, the results were both economically and statistically significant. While the R^2 was around 0.16, this was because of the huge amount of noise in the data generating process. Anything you could to do to increase the R^2 would just be fooling yourself.
One other critical point is the chart of the quantiles. I don’t think this is the best way to graphically interpret this kind of data. It can be more appropriate when there is some kind of non-linear relationship. However, in this case, you’re dealing with two normally distributed data points. No reason you can’t show the scatterplot when the regression line overlayed.
However, the scatterplot is not as informative in the case of the crime and IQ chart. In that case, you’re using a continuous variable to predict a discrete outcome. Something like a multinomial logistic regression might be more appropriate. In models like this, you don’t care as much about R^2. You would instead care about things like how well does the model classify the data or how many false positives are there.
The moral is much closer to this:
https://westhunt.wordpress.com/2015/04/02/back-by-popular-demand/
If you’re at all rational you have to hold as a possibly rebuttable presumption everything that supports progressivism is a lie.
Everything that supports almost *anything* is a lie. Progressivism isn’t the only ideology that’s in demand.
The crime correlation of – 0.2 comes from The Bell Curve, the income correlation of around 0.4 comes from Jensen. Neither of whom are known for being part of the Vast Anti-IQ Conspiracy. Sometimes statistics is just hard in a non-conspiratorial way.
Agreed – statistics is very hard.
The conspiracy part is in picking summary statistics to be deceptive – not that summary statistics are a bad idea or that they’re easy to produce well.
People want excuses so excuses get made.
In baseball fans wanted to understand the game better so they invented a whole bunch of statistical tools to do that and they were so successful that 25 years later every baseball team runs their orgainzation with those tools. Who actually wants to understand social problems? That’s not going to get you rich or famous – it’s going to get you labeled a thought criminal. There are no incentives* for producing good summary statistics.
* Yes, there are rare men out there who will look for the truth anyway.
The problem with this argument is that understanding baseball is much, much simpler than understanding society. There are countless different variables and countless different outcomes you’re interested in, and so few things are independent that it is next to impossible to control for all of them. Meanwhile, baseball has only a few things that can affect a plate appearance (and the batter and pitcher are the two that are responsible for most of the effects) and few outcomes of any particular plate appearance. Combine this with the fact that hitters will get over 500 plate appearences a year and starting pitchers will get 25+ starts a year (meaning that you get to have large sample sizes for each batter), and it’s plain to see why one lends itself to statistical analysis much more easily. Fans of a more complex sport (American football) have also tried to use statistical tools to understand that sport, and they have had nowhere near the success that the sabermetrics crowd had with baseball.
Comparing baseball stats to the field of sociology is like comparing apples to the entire produce section of your local supermarket.
Thinking more about the second graph, is it perhaps an issue of the mean vs the median? The averages end up distorted by a small number of millionaires who tend have higher IQ, but because most people aren’t millionaires IQ ends up not all that predictive.
One, when you say “millionaires” it makes me think of net worth. Net worth is not income, and I’m not sure which you actually meant.
Two, I’d want some data on “people who have a yearly income over a million in a given year”. My sense is this a fairly rare event and doesn’t map very well to IQ deciles. This article indicates that in 2011 there were about 400K individuals who reported income over 1 Million, and most of them were owned a business or were executive level in corporations.
My intuitive sense is that those who own their own successful business, while above average intelligence, don’t skew all the way to the right on IQ. Perhaps that’s a bias, which is why I would want more data.
My intuitive sense is that those who own their own successful business, while above average intelligence, don’t skew all the way to the right on IQ.
My sense is that you’re correct, and that even among earners of high salary, IQ isn’t very predictive. Somewhere above about IQ=120, other factors become more important in determining a person’s salary (as an employee) potential. Conscientiousness really makes a difference, as does willingness to be a people-pleaser (both your boss and your customers), as does the field you go into. These factors will also hold true for business owners – if you’re selling something only a few people will pay for, you’re not likely to get extremely rich no matter how smart or hard-working or better than your competition you are.
Just more intuition, but as a wild guess, I’d say if you look only at wage-earning professionals, there’s a strong positive correlation between IQ and salary, and if you look only at business owners, there’s a strong positive correlation between IQ and the success of the business. But the successful business owners aren’t any higher in IQ than the successful salaried professionals. That would map more to risk-tolerance and maybe family wealth (availability of seed capital).
Could also just be bias, though.
My sense is that the highest IQ individuals are underrepresented in the business owner category, and that they are clustered in research (both public and private), but maybe that is just growing up in a University Professor’s family in a University town (availability bias).
I understand that IQ tests were originally designed to predict performance at school. If high IQ is more highly correlated with being a university professor, that implies the original scientist did a good job at the job he was hired to do.
Whether the job was the right job is a different question.
Also, bar plots are the devil. Just give the scatter plot (or histogram or w/e) instead. There was a recent PLOS Biology paper on this that highlights some of the reasons to avoid them: http://www.plosbiology.org/article/fetchObject.action?uri=info:doi/10.1371/journal.pbio.1002128&representation=PDF
It’s also notoriously difficult to interpret parameter estimates (and assess model fit, etc.) from a table when your model(s, if you’re averaging across model uncertainty) is remotely complex. It’s way clearer imo to plot your inferences (e.g. credible sets for your lines and posterior predictive intervals for your predictions) than try to understand the inferred numbers (especially if you’re relatively new to statistical inference).
That paper appears to mean binning when it condemns bar chart. It is certainly right to condemn most binning. And most bar graphs are of summary statistics. But you advocate the histogram in place of the bar graph. What is the difference? Perhaps you mean: give us deciles, not just the median?
In other words, bar chart are bad because they show little information. But even if the amount of information is fixed, I think it is better to represent it by a scatter plot than a bar chart. eg
I think histograms are good when you want to visualize a continuous distribution of information (compared to binning the same distribution in a bar plot). I’d typically advocate scatterplots but they can be a bit confusing when you have a ton of information (and all your circles/points overlap or something — e.g. http://i1.wp.com/www.sumsar.net/figures/2014-11-13-how-to-summarize-a-2d-posterior-using-a-highest-density-ellipse/unnamed-chunk-2.png?zoom=1.5&w=456, though the article advocates HPD ellipses of varying size [and perhaps other sorts of envelopes for things that aren’t parameter estimates], which I think works better than what I was thinking of, which would have been something like https://i.stack.imgur.com/tSwe6.png with histograms of the marginal densities).
Thinking back, I think I was just confused over what a bar chart was. It seems they refer exclusively to representations of categorical variables, and not binned continuous variables, so I thought a “histogram with binning” fell under the umbrella of “bar chart” (since it has bars).
Huh? Isn’t a histogram exactly binning the data and displaying it in a bar chart? What is the alternative that they are better than?
If all your circles overlap, make them transparent and smaller. The second graph, plotting a kernel density is even better; the problem is doing it in 3d. Kernel density estimation is also better than histograms. But histograms are OK.
“Regardless of the amount of variance, going from a category where I can expect to make on average $40,000 to a category where I could expect to make on average $160,000 seems like a pretty big deal, and describing it as “only predicting 16% of the variation” seems patently unfair.”
Please forgive the naive questions from the non-statistician, but doesn’t the 16% figure refer to the variation between two individuals chosen randomly? If so, then the income difference between them will surely average out to less than the entire range . . . right?
Also, I’m not seeing the point being made with the bottom two graphs. Is one perceived as being more reflective of the date than the other? (Which one?)
It means that the variance of the data about the univariate regression curve is 16% less than the variance of the data about the mean.
That is, sum((y_actual – y_predicted)^2) = 0.84 * sum((y_actual – y_mean)^2).
Adam, when someone uses the terms “naive” and “non-statistician” to describe themselves, is an answer that relies and statistical jargon and knowledge really going to be the most helpful?
(Though, I’m sure it made things clearer to someone out there, so thanks for that on their behalf.)
Hmm, good point. It’s easy to visualize, though. Consider the plots generated by the following R code:
set.seed(1234)

x <- rnorm(50, 10, 5)

y <- 5 * x + rnorm(50, 0, 10)

plot(x, y)

abline(a=mean(y), b=0)

segments(x, y, x, rep(mean(y), 50))

plot(x, y)

abline(lm(y ~ x))

segments(x, y, x, fitted(lm(y ~ x)))
It gives you these:
plot1
plot2
If you sum up all the vertical line segments in the second plot, it’s a lot less than the sum of the vertical line segments in the first plot. If you sum the squares, then the percent difference is the percent of the variation in y explained by x.
It tells me that accessing those links is forbidden (based on IP address).
Damn it. I’ll find a better hosting. Thought Google drive with sharing set to public would work. Let us embed images, Scott.
Are they just images? How about a service like imgur.com?
Imgur works and I already have an account there. Even Facebook works. I just figured Google drive would work, too. Never actually tried it before right now.
“Please forgive the naive questions from the non-statistician, but doesn’t the 16% figure refer to the variation between two individuals chosen randomly? If so, then the income difference between them will surely average out to less than the entire range . . . right?”
I’m not sure I understand the question. The variance is the average square difference. So you can take two people, see how much they differ, and then square that number. If you take the average over all pairs, you get twice the variance (if you take the difference between people and the mean, you get the variance, but if you take the difference between pairs of people, it gets doubled).
A scatter plot that should be better known.
Perusing a programming blo, I just saw something about this kind of issue which I wasn’t sure how to bring to your attention. Now that there’s a hook, here it is: Bayes factors vs p-values.
I think the problem here is the frequentist approach rejects the hypothesis that the generating process for the random bits is fair (that number is way outside even a 99% confidence interval for p(1) = 0.5), but that isn’t remotely the same thing as confirming the hypothesis that a person can change bits by thinking. What was the guy with ESP claiming he could do? Flip all bits to 1? Then this is very poor evidence he can do that. If he was claiming he can flip all bits to 0, this is even worse evidence he can do that. If he was claiming he could make p(1) = 0.50018, then he’s in the 95% confidence interval. If he can replicate a whole bunch of times with different researchers and random bit generators, then he might even be correct.
John Cook has no idea what he’s talking about.
In this case or in general? The above excerpt is maybe muddled and careless but seems to be pointing at Lindley’s paradox, which is a real thing. The one thing he wrote that I remember reading closely (something about approximation errors in the delta method) held up under examination.
The wikipedia article on Lindley’s paradox is very clear. It clearly states that the “alternative hypothesis” is the prior. A prior just isn’t a hypothesis. The resolution of Lindley’s paradox is that using the Bayes factor for hypothesis testing is wrong.
In as much as people do use the Bayes factor for hypothesis testing, Lindley’s paradox is a thing and Cook’s account is fine.
But do they? Isn’t it more natural to use credible intervals for Bayesian hypothesis testing?
Even the Wikipedia account has some problems. I can only imagine how bad a case of Dunning-Kruger the editor who added the parenthetical “(Of course, one cannot actually use the MLE as part of a prior distribution)” must have, to contribute to an article like this without having heard of Empirical Bayes.
Anyways, I agree that these examples basically show Bayes factor as unsuitable for hypothesis testing. Even in Bayesian terms, it is a problem that the prior washes out for estimation but not for BF hypothesis comparison. And since a serious Bayesian would then not use such a broken procedure, “the Bayesian” in John Cook’s writeup and in Wikipedia should probably be called “the straw-Bayesian”?
Some Bayesian credible interval procedures should have frequentist asymptotic validity. Particularly badly chosen ones will not. Do you know if there are principles for credible interval construction that guarantee such validity?
Did Jeffreys propose the Bayes factor for hypothesis testing?
What is validity of a region? That it shrinks to the true point? If MAP is valid, then surely the HPD region is valid.
No idea what Jeffreys advocated. I’ve read foundational authors in frequentism (e.g., Fisher, Rao, Neyman, Wald, etc.) but, in retrospect, none in Bayesianism. My idea of what Bayesianism advocates is an average over roughly equal parts of Andrew Gelman, Christopher Bishop, and the mishmash of all the other second-hand sources.
By validity, I mean frequentist validity: equality between the claimed confidence level for a CI procedure and the probability under repeated trials of the resulting CI containing the true parameter generating the data. The asymptotic part would be to care about the large-sample limit of that probability.
Shrinking to a point does not necessarily follow for asymptotically valid procedures, but probably is what happens in most sane situations?
HPD would probably be asymptotically valid, at least when the posterior is nice. Nice conditions would also make the MAP estimator well-behaved, but I’m not sure how tightly connected the HPD region and the MAP estimate have to be?
I mention Jeffreys because Lindley elaborated on Jeffreys.
Of course the credible interval is not a confidence interval. You can only ask for validity in some asymptotic sense. What is that sense? Perhaps that the (prior?) measure of the symmetric difference goes to zero? But if both measures go to zero, as one expects, this comes for free. Probably you should ask for the measure of the symmetric difference to go to zero faster than the measures of the sets.
That MAP converges to the truth is pretty much the same as the statement that ML converges to a delta function at the truth. There is a standard theorem that ML deviates from the truth as a normal with variance the Fisher information. That sounds like the confidence regions are Fisher ellipsoids. I imagine that the same is true for the HPD regions for Jeffreys’s prior. And surely for any prior absolutely continuous with respect to Jeffreys’s prior.
I feel like these results shouldn’t be surprising if you know how linear regression works (and I assume Scott does, so at the risk of making unnecessary explanations…)
First of all, linear regression is asymmetric. The point is to predict y from x. If you were to predict x from y, you would get a different equation. So in the first problem Scott mentions, you are predicting crimes committed from IQ. As you can see from the scatter plot, if you know someone’s IQ, you really can’t predict their number of crimes committed. Therefore, r *should be* low. In fact, the variables don’t even look like they have a linear relationship, so you shouldn’t even run a linear regression on them.
In the (fake) IQ by Income scatter plot, it looks like there’s actually a linear relationship. You can plot a best fit line through this data. But think about how many data points will be far from that line! This is why r will be low. There are multiple ways of evaluating the fit of a linear regression, but all of them are based on the residuals. If the residuals are high, that means many data points are far from the line, and r will be low.
This makes sense because you’re evaluating how well the line fits the data. Looking at the scatter plot, *clearly* there’s a relationship between IQ and Income, but a best fit line would also not explain much of the variance, because look at how much scatter there is.
The bar chart is misleading in this case, because it shows means. If you average the y values for each x on the scatterplot, all of your points will be closer to the best fit line! So of course the means make the data look cleaner than the raw values. But the fact is there’s a lot of variance there, and you can’t very well predict income from IQ.
But you can probably predict *mean* income very well from IQ, and that’s what you’re getting at when you say, “…going from a category where I can expect to make on average $40,000 to a category where I could expect to make on average $160,000 seems like a pretty big deal…”
It’s true that you would get a different line. But the slope of the line is the correlation coefficient, which is symmetric. The R² is the same for predicting x from y as y from x.
The point about the slope is only true when the standard deviation of Y and X are the same (and in a univariate regression).
You might as well say that the two lines have different slopes because they have different units. One has units of crime/IQ and the other of IQ/crime.
I think what he might have meant is that the slopes will be exact reciprocals if all the variance in y is due to x, but not otherwise.
Since John’s statement is true, I think he meant what he said. But it’s just nit-picking about units.
Adam, your statement is also true, but a pretty bizarre way of stating it. The usual statement is the unitless statement that the lines are the same if correlation is ±1, which only happens if all the samples lie on a line. Anyhow, it is subsumed by my statement that the lines have the “same” slope, namely the correlation coefficient, although that statement is confusing because it requires switching the axes.
But forget about slopes. I was objecting to Tim’s statement that simple linear regression is not symmetric. This is not a precise statement, so there are certainly interpretations that are not symmetric. But the proportion of variance in X linearly explained by Y is the same as the proportion of variance of Y linearly explained by X. I think that’s a very symmetric situation. It doesn’t mean that the two regression lines are the same. But there is something quite symmetric about them. What that symmetry is, that is best left as an exercise.
Okay, never mind, I get what he was saying now. The slope in each case isn’t the correlation coefficient, though. It’s COV(x, y)/VAR(x) if you’re modeling y as the response to predictor x, and COV(x, y)/VAR(y) if you’re modeling x as the response to predictor y. Those coefficients are only the same if VAR(x) = VAR(y), which usually won’t be the case because they don’t measure the same thing, but you can always normalize so the variance is 1 anyway.
R^2 and the p-value of the coefficient will always be the same, though.
Yep, Douglas, you’re right! Thanks for the correction.
Also Adam is exactly right when he says:
“R^2 and the p-value of the coefficient will always be the same, though.”
I did not understand this, so thank you both.
The greatest efficacy of statistics is as a tool to inform (and hopefully improve) reality-based decisionmaking. It’s a push to use statistics as as aid to wisdom acquisition because the recursion loop for predictive success/validation is much longer, and like weather forecasting, the further into the future you must look for correlation, the less likely you are to see it.
The first number depends on the variance, the second number doesn’t.
The key, maybe, is that you don’t necessarily expect your income to be close to what you expect. I mean, if the expected value goes from $40,000 to $160,000 but the standard deviation is a million somehow, you still have no ability to predict.
Variance after all is expected deviation from expectation.
It would be transparently nonsensical to attempt to measure drug *use* by measuring drug-related *arrests*. How does this get a pass when generalized “crime” is at issue?
(Edit: this example is not just an illustration of the problem, either. This directly addresses a huge chunk of the actual data.)
I’m sorry this statement is incompatible with my life experiences, please revise
I will probably make a fool of myself now… but I think the moral of the story is roughly like the LW-ish equation of statistics = probability = prediction = truth is not actually that simple. One of these things is not like the other. Statistics does not lead you to directly to verbal truth-statements like “criminals are mostly stupid” or “people commit crimes mostly because they are stupid”.
I think it demonstrates that while our concept of truth evolved around verbal statements wearing a Y or N stamp, it cannot really be reduced to statistics. Perhaps you can reduce probability to statistics, but you either cannot reduce prediction to probability or truth to prediction. At least not natural-language ones.
What I see here is a deficiency of natural language, rather than of statistics. Well, to be kinder, natural language makes various tradeoffs in order to achieve its flexibility and applicability to a variety of purposes, and one of these is vagueness – and vague things aren’t quite as truth-apt as well-defined things. In short, natural language often trades off truth-aptness for broad coverage.
Suppose you have some data. With a summary statistic, the danger is that it will be true-but-misleading. With a verbal description, the danger is that it won’t even be wrong.
If equating numbers with truth is an error, then equating words with truth is a far worse error.
Close. And the issue is that basically there are different meanings and uses of the word truth.
Truth can be understood as a real world prediction engine, calibrated to engineer real world results. If you approach it from this world-domination angle, which is common in LW, you anchor your truth at it (math) and try as much as you can to catch up verbally. But it is a fairly new and unusual approach to truth.
The traditional understanding of truth is that it comes from a kind of social interchange which is verbal. People argue and debate and those who win, by being able to demonstrate what the other is saying untrue, get some kind of social points. This is the far more common understanding of truth, this is entirely verbal, and the mathemathical prediction engine is not really useful for this all the time.
The bit about arguments; there often isn’t a clear winner or loser – well, often you get both sides walking away thinking themselves the winner and the other side was just being ridiculous. Often you get accusations of definition-stretching, people noticing they’ve got into semantic arguments, etc. If the argument culture can be used to support a particular notion of truth, then the failures of argument culture can be used to demonstrate the limits of that notion.
Also, I think you’d get a lot of funny looks in a wide variety of circles if you said that there was no such thing as mathematical truth, or that mathematical truth wasn’t truth (unlike vegetarian bacon, which definitely isn’t bacon).
It’s interesting that I’ve got you to move from “our concept of truth” to “there are different meanings and uses of the word truth”. Also, you’ve only listed two, as if there was only LW-style pragmatism, complete with the taint of EY’s ego, and the folk concept. I’m not even convinced there is one concept that can be pinned down as “the folk concept”.
I would argue, that although philosophy, like statistics, dresses up language and tries to present it as very formal and rules based, language is best looked at as a collection of useful heuristics.
So a statement like “criminals are mostly stupid” isn’t even actually intended to be true. Just useful. And useful will vary based in the collection of heuristics to which the speaker is subject. It’s also important to remember these heuristics may belong to others, as we are social animals.
Useful doesn’t have to mean accurate either. It could simply be a way to cope with some mental hurdle.
None of these things maps onto “actually true” though. You can win an argument where you maintain that “Tigers are in the jungle” but if there really is a tiger in the woods, you still can get eaten by it.
If I was feeling particularly emphatic – and nerdy – I might say something like “criminals are mostly stupid, for all sensible values of ‘criminals’, ‘mostly’ and ‘stupid'”. There’s a whole complicated set of issues to do with construal here, but – I think – generally I’d be happy saying that “criminals are mostly stupid” is true on the grounds that were I to come up with some well-defined construal of the statement without any funny business, that well-defined thing would most likely work out to be true. Or am I mis-theorizing language here?
“Tigers are in the jungle” brings up the whole thing of bare plural generics, which can be really striking. Apparently you can get away with going from “10% of mosquitoes spread West Nile Virus” to “mosquitoes spread West Nile Virus”, and from “mosquitoes spread West Nile Virus” to “90% of mosquitoes spread West Nile Virus”. (I may be mis-remembering the exact numbers and it takes a little while to find the relevant papers…) You might notice the irony of me talking about bare plural generics in this way.
@Peter:
Is a sensible value for “mostly” 50.1%?
Is a sensible meaning for “criminal” “caught and convicted”?
Is a sensible value for “stupid” 90 IQ?
The statement isn’t precise enough to evaluate its actual truth. Only in knowing some actual truths could you decide whether that sentence encompasses them, but it wouldn’t change how imprecise the sentence is.
Edit: I’ll note that I am neither a linguist nor a holder of a degree in English, so I confess the “bare plural generics” reference is causing me to google.
@HeelBearCub
The values you given for ‘criminals’, ‘mostly’ and ‘stupid’ – assuming you mean ‘>=50.1%’ and ‘<=90 IQ', look a bit on the generous side, i.e. they err on the side of saying too little. But if you plug in those values you've got something truth-apt.
If I were to say "criminals are mostly highly intelligent" then… I think the "funny business" clause might appear, as I might sneakily be construing "highly intelligent" as "upper quartile for Kingdom Animalia", but without funny business. If it turned out that criminals averaged IQ 125 or something there might be serious truth-aptness problems. On the other hand, if at least 50.1% of criminals had an IQ less than 100, then no matter where you put the threshold for _highly_ intelligent, the median criminal would be below it, so I'd happily "criminals are mostly highly intelligent" false, and thereby truth-apt.
It's like there's vaugeness in the definition of a mountain, both in terms of mountains vs hills and also where the mountain stops and the surrounding terrain starts[1], but when you're at the summit of Everest you're definitely on a mountain.
[1] I expect a geographer or geologist to disagree here…
Raw measurement allows you to make very precise statements, like of 4552 Danish men born at the end of WWII, those who had been arrested for two or more criminal offenses before age 20 had on average a standard deviation lower IQ than those who had been arrested for zero criminal offenses.
If you have a sufficiently representative sample, reliable measurements, ideally some independent replication, and guarantees of things like time-invariance, you can use statistics to test how well your measurements support reasonable best guesses about similar characteristics to what you measured in the broader population.
Does this study, alone, support the inference that in whatever country you live in and care about, 70 years later, among both men and women, that people who commit actions that either do violence to or deprive others of property, whether or not they get caught, are also likely to average a standard deviation lower IQ?
Probably not on its own, but if similar studies produced similar results, their collective weight probably gives credence to that. If you want to transform that statement to “most criminals are stupid,” sure, I guess that’s how science journalism works and not everybody is publishing in a peer-reviewed professional journal.
@Peter:
I think you are misconstruing what were primarily rhetorical questions. I can’t tell if you are doing so willfully, or misunderstood what I was getting at.
But as you essentially point out, “sensible” isn’t precise enough to say whether my values fall under your definition of those things (They “look a bit on the generous side”). I would maintain that sensible becomes just another imprecise, vague, fuzzy heuristic that is useful and adds no precision to the original statement.
Note that in the previous post you said “were I to come up with some well-defined construal of the statement”. Well the fact that you need to define it well (i.e. those words themselves are not nearly precise enough) illustrates my point quite nicely.
@HeelBearCub – sorry, I’m not wonderful at spotting rhetorical questions. Also I think my first paragraph had two separate points – the quip about “for all sensible values” and the speculation about construal and I don’t think I made the separation between them clear. Apologies if you’re finding this vexing…
(Also – side point – when I’m arguing about whether something is truth-apt or not, I’m not saying that it is knowable or verifiable or falsifiable or whatever – see for example Godel’s theorem.)
I suppose my main point is that I think you can speculate about the truth or otherwise of vague propositions in a detached, disinterested way, without practical consequences, and sometimes you can even do this meaningfully; I’m not convinced by a pure pragmatist approach to semantics. That’s not to say that our semantic habits haven’t been shaped by pragmatic purposes, just that they can carry on under their own momentum even when being used in a disinterested manner.
Thought experiment – get a vague statement like “criminals are mostly stupid”. Find 100 people, for each person get them to pluck values for “criminals” etc. from wherever, just like you did, and then get them to hash things out further until you have something precise. You now have 100 statements which are definitely truth-apt (the truth of some of these may be unknowable, but this is a thought experiment so that isn’t an issue), so you can talk about what proportion of them are true. I’m theorizing on the fly here, but I think that if all of them come out true then … dammit, I’m about to sink into another quagmire of vagueness, but I’m reasonably happy calling such a statement true, and if 50% come out true and 50% come out false, then … I was about to say I was happy to call a statement hopelessly vague and not really truth-apt, but that makes the vagueness or otherwise of a statement contingent on the world and that’s really unsatisfying. Dammit. Theorizing on the fly in SSC comments can be great fun but not if you like winning arguments…
IMO vagueness is a really hard problem, much harder than ambiguity. Some sort of appeal to pragmatic concerns may well be a part of the solution here but there are lots of ways to do that; compare the pragmatism of William James with the pragmaticism of C. S. Pierce for example.
@Peter:
I see where you are coming from. If you missed that those were (essentially) rhetorical, then that’s on me for not making it clear enough.
One important point, I was originally replying to Shenpen and my point was to challenge his idea that “truth” in the traditional understanding derived from argument and not math. I am arguing for an even looser definition of truth in the common usage.
I am arguing that humans are predisposed to describe as true those things which we find applicable or useful.
This is quite different than where it seems you are coming from, which is that language can be made to describe reality (objective truth), if we are careful enough about how we use it. I believe I am in agreement with you on that point, if I am accurately understanding your position.
To put it another way, I am NOT saying that truth is always unknowable, or that the truth of a statement can never be established, or that all truth is relative.
But this is really a different point than what I was trying to make, and the one Shenpen seemed to be trying to make, which is about how language, and in particular the word “truth”, tends to be used most commonly.
It might lead to statements like these: “For a young man in Denmark from 1961 to 1965, whatever other propensities he might have, not being cognitively impaired was very likely sufficient to keep him from getting convicted of a crime more than once.”
You can use statistics in many ways, from easiest to hardest:
* direct measures of a population (how many men in this age group in Denmark were convicted of more than two crimes?)
* statistical inference about a population (Out of a sample of 100 randomly selected Danish men, this many committed crimes. How many committed crimes in the larger population?)
* Prediction based on information about a population (you are presented with this information about a specific Danish man, but not his criminal record. How likely is it that he’s committed two or more crimes?)
* Causal inference (If you give subsidized dental care to a young Danish man, how does it affect his chance of being convicted of two or more crimes?)
* Mechanistic causal inference (you have a model that fully predicts whether a young Danish man will become convicted for two or more crimes, and are confident that any uncertainty in prediction is down to uncertainty in measurement. Yeah, not likely to happen, but in physics such models can happen.)
Pingback: “demand to see the scatter plot” | Kenny Evitt
Okay I know I already responded to this, but it occurred to me that there’s a mathematical relation that makes this simple to understand.
(beta * sigma_x) / sigma_y = rho
where rho is the correlation coefficient, beta the regression coefficient for predicting y from x, and sigma_x and sigma_y are the standard deviations of x and y. If you don’t believe me, see here.
What you’re talking about is a case where beta is high and rho is low. And the reason is that to get rho, you have to divide by sigma_y.
rho tells you when the effect of learning x on your estimate of y (beta) is small compared to the natural variation in y (sigma_y). Not when it’s small in absolute terms.
One simple comment is that if either of those results (the paragraph or the plot) had included measures of precision – 95% CIs for the IQ difference, and possibly the SD for earnings in each IQ decile – a lot of the surprise would go away. You’d quickly see in the plot, for example, that while you might expect to earn $160,000, you could very realistically earn anywhere from $40,000 to $300,000, or something.
That graph says the top decile of IQ make on average 72K, not 60K, unless I’m missing something.
One graph says 160k, the other 72k. You are the first person to mention 60k.
The one showing 72 is made up numbers some guy on tumblr used to demonstrate to Scott how a bar chart showing only decile means smooths out high-variance data. 160 is the mean income of the top IQ decile as actually measured by the NLSY79 survey.
I went ahead and pulled the actual data and reproduced the bar chart plus a scatterplot with a regression line. Hopefully, images shared from github can actually be viewed. This is the scatterplot and this is the barchart and the repo is here and includes the data csv and the script to make the plots. “IQ” is estimated from the subjects’ AFQT scores on the ASVAB, taken in 1981. “Income” is their net family income in 2012.
That, by the way, I think explains part of why it is so high. This includes spouse income and the NLSY79 didn’t actually include a separate measurement of individual income. You have to figure that amplifies the effect a bit, as I’d expect high-IQ men to marry high-IQ women and vice versa.
if that chart of income vs. ‘IQ’ comes from the NLSY, it is likely *not* a good measure of IQ and income. If you are using the NLSY AFQT score measure, you are susceptible to the same problems that made “The Bell Curve” junk science (that is, junk *social* science, an impressively low bar). The AFQT score at 16 is an achievement measure that mixes cognitive skills, non-cognitive skills (perserverance, discipline, etc.), education, and family background — definitely not a pure measure of biological IQ potential. The easiest way to adjust for that is just to control for years of completed education, which will adjust away a lot of the background differences, and in any case should not eliminate a pure IQ effect, if such a thing exists. If you did the residualized income after an education adjustment you would see a more limited effect — one of the reasons why good studies find a limited role of pure IQ on adult success.
I take all this back if someone added some kind of reasonable childhood IQ test score to the NLSY while I wasn’t looking.
They didn’t. I just posted the actual data above. Note that both IQ and income aren’t really what most people would think when they hear those things. When you remove everyone who didn’t take the ASVAB or didn’t report a net family income, you end up with 5,873 respondents.
Also, the actual standard deviation for income in the lowest AFQT decile is 29985 and the standard deviation for income in the highest decile is 128536. So yeah, as has been stated a hundred times by now, that’s your reason that the average can be that much higher but only explain 16% of the variance. Huge residuals.
Oh yeah, also they top code everything over 300K to 500K, so the actual standard deviation is even greater.
To anyone wondering whether this is wrong, yes. Just read the third appendix for The Bell Curve. The book can easily be found on libgen.
TL;DR It is similar to other IQ tests regarding internal structure and test items. It shows strong correlations to other IQ tests.
r^2 assumes a bivariate normal distribution. What you want is mutual information.
No, it does not assume a normal distribution.
R² is the amount of variance explained by a linear relationship, regardless of the distributions. It is true that empirical R² is a poor estimate of the true R² if the distributions are not normal.
But I think you really mean to complain that there could be a problem if the relationship is not linear. But some of the invented data was linearly related, indeed, bivariate gaussian, yet it still illustrated many of the same points.
Obviously, if the relationship is not monotone, linear regression is a terrible idea. But if the relationship is monotone, in practice the linear regression captures most of the relation. For example, in the NLSY, the correlation between IQ and income is 0.44, while the correlation between IQ and log(income) is 0.47. They can’t both be linear.
For an artificial example, say college is determined by IQ. Everyone with an IQ above average goes and no one below. The relation is not linear, so linear R²<1. But still R²=0.64. That is symmetric: IQ linearly determines 64% of the variance of college, and college determines 64% of the variance of intelligence. In reality, IQ determines 100% of the variance of college and college determines 64% of the variance of IQ.
My NLSY example is mistaken. I had restricted to individuals with positive income. For them, the correlation between IQ and income is 0.44, pretty much the same as the correlation between IQ and log income, 0.47. If we include incomes with zero income, the linear correlation stays the same, but the correlations between IQ and log1p or inverse hyperbolic sine is 0.34 and 0.33, respectively. The loss on transformation is comparable to the loss in the artificial example.
Could it be the reverse of the crime chart? There are a few high paying jobs that only high IQ people get, and everyone else is basically the same?
Would also like to know the IQ range in each decile.
Also, are the trends consistent in each profession?
Statistical analysis brain modules should be required for all public school students.
In other words, you’re saying low IQ might be a necessary but not sufficient condition for criminality? And in general, small correlations between A and B can’t rule out the possibility that A is a necessary but not sufficient condition for B?
“In other words, you’re saying low IQ might be a necessary but not sufficient condition for criminality?”
Remember, “criminality” in this context specifically means getting convicted of a crime at least twice between age 16 and 20 or so. In peaceful Denmark, in the mid-1960s. Yes, it’s not very surprising that low IQ would be a “necessary” condition to be that extreme (necessary in quotes because we don’t know about causality here – there could be things that contribute both to low IQ scores and criminality, like neurological damage, childhood abuse, head trauma etc.)
Pingback: Some musings on statistics | Jacob Silterra
Regarding the first, be sure to read this paper too:
Ferguson, C. J. (2009). Is psychological research really as good as medical research? Effect size comparisons between psychology and medicine. Review of General Psychology, 13(2), 130.
TL;DR sometimes psych correlation sizes have been compared to medicine. These comparisons often show that psych effects are strong compared to medicine. However, due to the very low base rate of some medical problems, the correlations are ‘artificially’ small. Correct for that and you see large effects. Great paper.
Concerning the interpretation of small to medium correlations and grouped data, the best paper to read is this one:
Lubinski, D., & Humphreys, L. G. (1996). Seeing the forest from the trees: When predicting the behavior or status of groups, correlate means. Psychology, Public Policy, and Law, 2(2), 363.
Great paper, very undercited IMO.
Pingback: Links for May 2015 - foreXiv