
I.
I briefly snarked about Leslie et al (2015) last week, but I should probably snark at it more rigorously and at greater length.
This is the paper that concludes that “women are underrepresented in fields whose practitioners believe that raw, innate talent is the main requirement for success because women are stereotyped as not possessing that talent.” They find that some survey questions intended to capture whether people believe a field requires innate talent correlate with percent women in that field at a fairly impressive level of r = -0.60.
The media, science blogosphere, et cetera has taken this result and run with it. A very small sample includes: National Science Foundation: Belief In Raw Brilliance May Decrease Diversity. Science Mag: the “misguided” belief that certain scientific fields require brilliance helps explain the underrepresentation of women in those fields. Reuters: Fields That Cherish Genius Shun Women. LearnU: Study Findings Point To Source Of Gender Gap In STEM. Scientific American: Hidden Hurdle Looms For Women In Science. Chronicle Of Higher Education: Disciplines That Expect Brilliance Tend To Punish Women. News Works: Academic Gender Gaps Tied To Stereotypes About Genius. Mathbabe: “The genius myth” keeps women out of science. Vocativ: Women Avoid Fields Full Of Self-Appointed Geniuses. And so on in that vein.
Okay. Imagine a study with the following methodology. You survey a bunch of people to get their perceptions of who is a smoker (“97% of his close friends agree Bob smokes”). Then you correlate those numbers with who gets lung cancer. Your statistics program lights up like a Christmas tree with a bunch of super-strong correlations. You conclude “Perception of being a smoker causes lung cancer”, and make up a theory about how negative stereotypes of smokers cause stress which depresses the immune system. The media reports that as “Smoking Doesn’t Cause Cancer, Stereotypes Do”.
This is the basic principle behind Leslie et al (2015).
The obvious counterargument is that people’s perceptions may be accurate, so your perception measure might be a proxy for a real thing. In the smoking study, we expect that people’s perception of smoking only correlates with lung cancer because it correlates with actual smoking which itself correlates with lung cancer. You would expect to find that perceived smoking correlates with lung cancer less than actual smoking, because the perceived smoking correlation is just the actual smoking correlation plus some noise resulting from misperceptions.
So I expected the paper to investigate whether or not perceived required ability correlated more, the same as, or less than actual required ability. Instead, they simply write:
Are women and African-Americans less likely to have the natural brilliance that some fields believe is required for top-level success? Although some have argued that this is so, our assessment of the literature is that the case has not been made that either group is less likely to possess innate intellectual talent1.
So we will have to do this ourselves. The researchers helpfully include in their supplement a list of the fields they studied and GRE scores for each, as part of some sub-analysis to check for selectivity. GRE scores correlate closely with IQ and with a bunch of measures of success in graduate school, so this sounds like it would be a good test of the actual required ability hypothesis. Let’s use this to figure out whether actual innate ability explains the discrepancies better or worse than perceived innate ability does.
When I use these data I find no effect of GRE scores on female representation.
But these data are surprising – for example, Computer Science had by far the lowest GRE score (and hence projected IQ?) of any field, which matches neither other sources nor my intuition. I looked more closely and found their measure combines Verbal, Quantitative, and Writing GREs. These are to some degree anti-correlated with each other across disciplines2; ie those disciplines whose students have higher Quantitative tend to have lower Writing scores (not surprising; consider a Physics department versus an English department).
Since the study’s analysis included two measures of verbal intelligence and only one measure of mathematical intelligence, it makes more mathematical departments appear to have lower scores and lower innate ability. Certainly a measure set up such that computer scientists get the lowest intelligence of everyone in the academy isn’t going to find innate ability related to STEM!
Since the gender gap tends to favor men in more mathematical subjects, if we’re checking for a basis in innate ability we should probably disentangle these tests and focus on the GRE Quantitative. I took GRE Quantitative numbers by department from the 2014 edition of the ETS report. The results looked like this:
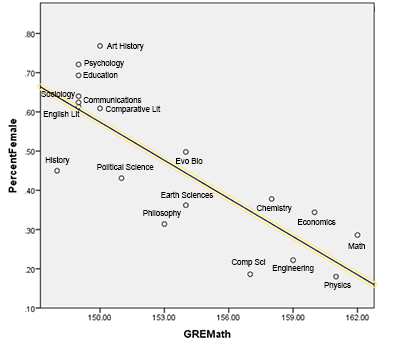
There is a correlation of r = -0.82 (p = 0.0003) between average GRE Quantitative score and percent women in a discipline. This is among the strongest correlations I have ever seen in social science data. It is much larger than Leslie et al’s correlation with perceived innate ability3.
Despite its surprising size this is not a fluke. It’s very similar to what other people have found when attempting the same project. There’s a paper from 2002, Templer and Tomeo, that tries the same thing and finds r = 0.76, p < 0.001. Randal Olson tried a very similar project on his blog a while back and got r = 0.86. My finding is right in the middle.
A friendly statistician went beyond my pay grade and did a sequential ANOVA on these results4 and Leslie et al’s perceived-innate-ability results. They found that they could reject the hypothesis that the effect of actual innate ability was entirely mediated by perceived innate ability (p = 0.002), but could not reject the hypothesis that the effect of perceived-innate-ability was entirely mediated by actual-innate ability (p = 0.36).
In other words, we find no evidence for a continuing effect of people’s perceptions of innate ability after we adjust for what those perceptions say about actual innate ability, in much the same way we would expect to see no evidence for a continuing effect of people’s perceptions of smoking on lung cancer after we adjust for what those perceptions say about actual smoking.
II.
Correlation is not causation, but a potential causal mechanism can be sketched out.
I’m going to use terms like “ability” and “innate ability” and “genius” and “brilliance” because those are the terms Leslie et al use, but I should clarify. I’m using them the way Leslie et al seem to, as a contrast to hard work, the internal factors that give different people different payoffs per unit effort. So a genius is someone who can solve difficult problems with little effort; a dullard is one who can solve them only with great effort or not at all.
This use of “innate ability” is not the same thing as “genetically determined ability”. Genetically determined ability will be part of it, but there will also be many other factors. Environmental determinants of intelligence, like good nutrition and low lead levels. Exposure to intellectual stimulation during crucial developmental windows. The effect of steretoypes, insofar as those stereotypes globally decrease performance. Even previous training in a field might represent “innate ability” under this definition, although later we’ll try to close that loophole.
Academic programs presumably want people with high ability. The GRE bills itself as an ability test, and under our expanded definition of ability this is a reasonable claim. So let’s talk about what would happen if programs selected based solely on ability as measured by GREs.
This is, of course, not the whole story. Programs also use a lot of other things like grades, interviews, and publications. But these are all correlated with GRE scores, and anyway it’s nice to have a single number to work with. So for now let’s suppose colleges accept applicants based entirely on GRE scores and see what happens. The STEM subjects we’re looking at here are presumably most interested in GRE Quantitative, so once again we’ll focus on that.
Mathematics unsurprisingly has the highest required GRE Quantitative score. Suppose that the GRE score of the average Mathematics student – 162.0 – represents the average level that Mathematics departments are aiming for – ie you must be this smart to enter.
The average man gets 154.3 ± 8.6 on GRE Quantitative. The average woman gets 149.4 ± 8.1. So the threshold for Mathematics admission is 7.7 points ahead of the average male test-taker, or 0.9 male standard deviation units. This same threshold is 12.6 points ahead of the average female test-taker, or 1.55 female standard deviation units.
GRE scores are designed to follow a normal distribution, so we can plug all of this into our handy-dandy normal distribution calculator and find that 19% of men and 6% of women taking the GRE meet the score threshold to get into graduate level Mathematics. 191,394 men and 244,712 women took the GRE last year, so there will be about 36,400 men and 14,700 women who pass the score bar and qualify for graduate level mathematics. That means the pool of people who can do graduate Mathematics is 29% female. And when we look at the actual gender balance in graduate Mathematics, it’s also 29% female.
Vast rivers of ink have been spilled upon the question of why so few women are in graduate Mathematics programs. Are interviewers misogynist? Are graduate students denied work-life balance? Do stereotypes cause professors to “punish” women who don’t live up to their sexist expectations? Is there a culture of sexual harassment among mathematicians?
But if you assume that Mathematics departments are selecting applicants based on the thing they double-dog swear they are selecting applicants based on, there is literally nothing left to be explained5.
I am sort of cheating here. The exact perfect prediction in Mathematics is a coincidence. And I can’t extend this methodology rigorously to any other subject because I would need a much more complicated model where people of a given score level are taken out of the pool as they choose the highest-score-requiring discipline, leaving fewer high-score people available for the low-score-requiring ones. Without this more complicated task, at best I can set a maximum expected gender imbalance, then eyeball whether the observed deviation from that maximum is more or less than expected. Doing such eyeballing, there are slightly fewer women in graduate Physics and Computer Science than expected and slightly more women in graduate Economics than expected.
But on the whole, the prediction is very good. That it is not perfect means there is still some room to talk about differences in stereotypes and work-life balance and so on creating moderate deviations from the predicted ratio in a few areas like computer science. But this is arguing over the scraps of variance left over, after differences in mathematical ability have devoured their share.
III.
There are a couple of potentially very strong objections to this hypothesis. Let me see if I can answer them.
First, maybe this is a binary STEM vs. non-STEM thing. That is, STEM fields require more mathematical aptitude (obviously) and they sound like the sort to have more stereotypes about women. So is it possible that my supposedly large sample size is actually just showing an artifact of division into these two categories?
No. I divided the fields into STEM and non-STEM and ran an analysis within each subgroup. Within the non-STEM subgroup, there was a correlation between GRE Quantitative and percent female in a major of -0.64, p = 0.02. It is completely irresponsible to do this within the STEM subgroup, because it has n = 7 which is too small a sample size to get real results. But if we are bad people and do it anyway, we find a very similar correlation of -0.63. p is only 0.12, but with n=7 what did you expect?
Both of these correlations are higher than Leslie et al were able to get from their entire sample.
Second, suppose that it’s something else driving gender-based patterns in academia. Maybe stereotypes or long hours or whatever. Presumably, these could operate perfectly well in undergrad. So stereotypes cause lots of men to go into undergraduate math and lots of women to go into undergraduate humanities. The men in math classes successfully learn math and the women in humanities classes successfully learn humanities. Then at the end of their time in college they all take the GRE, and unsurprisingly the men who have been taking all the math classes do better in math. In this case, the high predictive power of mathematical ability would be a result of stereotypes, not an alternative to them.
In order to investigate this possibility we could look at SAT Math instead of GRE Quantitative scores, since these would show pre-college ability. SAT scores show a gap much like that in GRE scores; in both, the percentile of the average woman is in the low 40s.
Here is a graph of SAT Math scores against percent women in undergraduate majors:
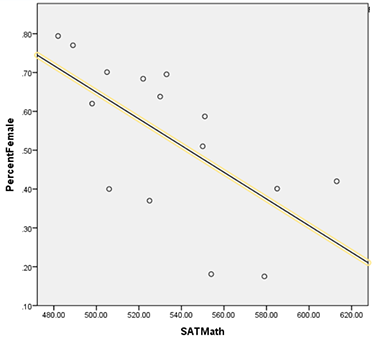
SAT Math had a correlation of -0.65, p = 0.016.
This correlation is still very strong. It is still stronger than Leslie et al’s correlation with perceived required ability. But it is slightly weaker than the extremely strong correlation we find with GRE scores. Why?
I can’t answer that for sure, but here is a theory. The “undergraduate major” data is grabbed from what SAT test-takers put down as their preferred undergraduate major when they take the test in (usually) 11th grade. The “percent female” data is grabbed from records of degrees awarded in each field. So these are not exactly the same people on each side. One side shows the people who thought they wanted to do Physics in 11th grade. The other side shows the people who ended up completing a Physics degree.
The people who intend to pursue Physics but don’t end up getting a degree will be those who dropped out for some reason. While there are many reasons to drop out, one no doubt very common one is that the course was too hard. Therefore, the people who drop out will be disproportionately those with lower mathematical ability. Therefore, the average SAT Math score of 11th grade intended Physics majors will be lower than the average SAT Math score of Physics degree earners. So the analysis above likely underestimates the average SAT Math score of people in mathematical fields. This could certainly explain the lower correlation, and I predict that if we could replace our unrepresentative measure of SAT scores with a more representative one, much of the gap between this correlation and the previous one would close.
These data do not rule out simply pushing everything back a level and saying that these stereotypes affect what classes girls take in middle school and high school. Remember, we using “ability” as a designation for a type of excellence, not an explanatory theory of it. This simply confirms that by eleventh grade, the gap has already formed.7.
Third, perhaps SAT and GRE math tests are not reflective of women’s true mathematical ability. This is the argument from stereotype threat, frequently brought up as reasons why tests should not be used to judge aptitude.
But this is based on a fundamental misunderstanding of stereotype threat found in the popular media, which actual researchers in the field keep trying to correct (to no avail). See for example Sackett, Hardison, and Cullen (2004), who point out that no research has ever claimed stereotype threat accounts for gender gaps on mathematics tests. What the research found was that, by adding an extra stereotype threat condition, you could widen those gaps further. The existing gaps on tests like the SAT and GRE correspond to the “no stereotype threat” control condition in stereotype threat experiments, and “absent stereotype threat, the two groups differ to the degree that would be expected based on differences in prior SAT scores”. Aronson and Steele, who did the original stereotype threat research and invented the field, have confirmed that this is accurate and endorsed the warning.
Anyway, even if the pop sci version of stereotype threat were entirely true and explained everything, it still wouldn’t rescue claims of bias or sexism in the sciences. It would merely mean that the sciences’ reasonable and completely non-sexism-motivated policy of trusting test scores was ill-advised.8
Fourth, might there be reverse causation? That is, suppose that there are stereotypes and sexism restricting women’s entry into STEM fields, and unrelatedly men have higher test scores. Then the fields with the stereotypes would end up with the people with higher test scores, and it would look like they require more ability. Might that be all that’s happening here?
No. I used gender differences in the GRE scores to predict what scores we would expect each major to have if score differences came solely from differences in gender balance. This predicted less than a fifth of the variation. For example, the GRE Quantitative score difference between the average test-taker and the average Physics graduate student was 9 points, but if this were solely because of differential gender balance plus the male test advantage we would predict a difference of only 1.5 points. The effect on SAT scores is similarly underwhelming.
But I think the most important thing I want to say about objections to Part II is that, whether they’re correct or not, Part I still stands. Even if the correlation between innate ability and gender balance turns out to be an artifact, Leslie et al’s correlation between perceived innate ability and gender balance is still an artifact of an artifact.
IV.
A reader of an early draft of this post pointed out the imposingly-named Nonlinear Psychometric Thresholds In Physics And Mathematics. This paper uses SAT Math scores and GPA to create a model in which innate ability and hard work combine to predict the probability that a student will be successful in a certain discipline. It finds that in disciplines “such as Sociology, History, English, and Biology” these are fungible – greater work ethic can compensate for lesser innate ability and vice versa. But in disciplines such as Physics and Mathematics, this doesn’t happen. People below a certain threshold mathematical ability will be very unlikely to succeed in undergraduate Physics and Mathematics coursework no matter how hard-working they are.
And that brought into relief part of why this study bothers me. It ignores the pre-existing literature on the importance of innate ability versus hard work. It ignores the rigorous mathematical techniques developed to separate innate ability from hard work. Not only that, but it ignores pre-existing literature on predicting gender balance in different fields, and the pre-existing literature on GRE results and what they mean and how to use them, and all the techniques developed by people in those areas.
Having committed itself to flying blind, it takes the thing we already know how use to predict gender balance, shoves it aside in favor of a weird proxy for that thing, and finds a result mediated by that thing being a proxy for the thing they are inexplicably ignoring. Even though it just used a proxy for aptitude to predict gender balance, everyone congratulates it for having proven that aptitude does not affect gender balance.
Science journalism declares that the myth that ability matters has been vanquished forever. The media take the opportunity to remind us that scientists are sexist self-appointed geniuses who use stereotypes to punish women. And our view of an important issue becomes just a little muddier.
I encourage everyone to reanalyze this data and see if I’m missing something. You can find the GRE data I used here and the SAT data here (both in .xlsx format).
Footnotes
1. They cite for this claim, among other things, Stephen Jay Gould’s The Mismeasure Of Man
2. Beware the ecological fallacy; these scores are still positively correlated in individuals.
3. It was also probably more highly significant, but I can’t tell for sure because (ironically) their significance result wasn’t to enough significant digits.
4. There was a small error in the percent of women in Communications in the dataset I provided them with, so these numbers are off by a tiny fraction from what you will get if you try to replicate. I didn’t feel comfortable asking them to redo the entire thing, but the small error would not have changed the results significantly, and the tiny amount it would have changed them would have been in the direction of making the innate ability results more striking rather than less.
5. Although Leslie et al focused on women, they believe their results could also extend to why African-Americans are underrepresented compared to European-Americans and Asian-Americans in certain subjects. They theorize that European and Asian Americans, like men, are stereotyped as innately brilliant, but African-Americans, like women, lack this stereotype. I find this a bit off – after all, in the gender results, they contrasted the male “more innately brilliant” stereotype with the female “harder-working” stereotype, but African Americans suffer from a stereotype of not being hard-working, and Asian-Americans do have a stereotype of being hard-working, even more so than women. Anyway, this is only a mystery if you stick to Leslie et al’s theory of stereotypes about perceived innate ability. Once you look at GRE Quantitative scores, you find that whites average 150.8, Asians average 153.9, and blacks average 143.7, and there’s not much left to explain.
6. It’s hard to correlate SAT scores with majors, because the SAT data is full of tiny vocational majors that throw off the results. For example, there are two hundred people in the country studying some form of manufacturing called “precision production”, they’re almost all male, and they have very low SAT scores. On the other hand, there are a few thousand people studying something called “family science”, they’re almost all women, and they also all have very low SAT scores. The shape of gender*major*SAT scores depends almost entirely on how many of these you count. I circumvented the entire problem by just counting the fields that approximately corresponded to the ones Leslie et al counted in their graduate-level study. I tried a few different analyses using different ways of deciding which fields to count, and as long as they were vaguely motivated by a desire to include academic subjects and not the vocational subjects with very low scores, they all came out about the same.
7. The argument that stereotypes cause boys to take more middle school and high school math classes than girls is somewhat argued against by the finding that actually girls take more middle school and high school math classes than boys. However, there are some contrary results; for example, boys are more likely than girls to take the AP Calculus test. This entire area gets so tangled up in differing levels of interest and ability and work-ethic that it’s not worth it, at my level of interest and ability and work ethic, to try to work it out. The best I can say is that the gap appears by the time kids take the SAT in 11th grade.
8. I can’t help adding that I continue to believe that the stereotype threat literature looks like a null field which continues to exist only through publication bias and experimenter effects. The funnel plot shows a clear peak at “zero effect” and an asymmetry indicating a publication bias for positive results (for some discussion of why I like funnel plots, see here.) And a closer look at the individual research shows this really disturbing pattern of experiments by true believers finding positive effects, experiments by neutral parties and skeptics not finding them, replication attempts failing, and large real-world quasi-experiments turning up nothing – in a way very reminiscent of parapsychology. Although I am far from 100% sure, I would tentatively place my money on the entire idea of stereotype threat vanishing into the swamp of social psychology’s crisis of replication.


