I.
First we have False Positive Psychology: Undisclosed Flexibility In Data Collection And Analysis Allows Presenting Anything As Significant (h/t Jonas Vollmer).
The message is hardly unique: there are lots of tricks unscrupulous or desperate scientists can use to artificially nudge results to the 5% significance level. The clarity of the presentation is unique. They start by discussing four particular tricks:
1. Measure multiple dependent variables, then report the ones that are significant. For example, if you’re measuring whether treatment for a certain psychiatric disorder improves life outcomes, you can collect five different measures of life outcomes – let’s say educational attainment, income, self-reported happiness, whether or not ever arrested, whether or not in romantic relationship – and have a 25%-ish probability one of them will come out at significance by chance. Then you can publish a paper called “Psychiatric Treatment Found To Increase Educational Attainment” without ever mentioning the four negative tests.
2. Artificially choose when to end your experiment. Suppose you want to prove that yelling at a coin makes it more likely to come up tails. You yell at a coin and flip it. It comes up heads. You try again. It comes up tails. You try again. It comes up heads. You try again. It comes up tails. You try again. It comes up tails again. You try again. It comes up tails again. You note that it came up tails four out of six times – a 66% success rate compared to expected 50% – and declare victory. Of course, this result wouldn’t be significant, and it seems as if this should be a general rule – that almost by the definition of significance, you shouldn’t be able to obtain it just be stopping the experiment at the right point. But the authors of the study perform several simulations to prove that this trick is more successful than you’d think:
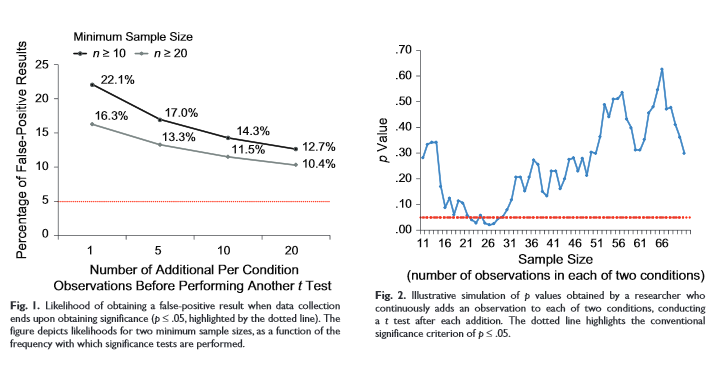
3. Control for “confounders” (in practice, most often gender). I sometimes call this the “Elderly Hispanic Woman Effect” after drug trials that find that their drug doesn’t have significant effects in the general population, but it does significantly help elderly Hispanic women. The trick is you split the population into twenty subgroups (young white men, young white women, elderly white men, elderly white women, young black men, etc), in one of those subgroups it will achieve significance by pure chance, and so you declare that your drug must just somehow be a perfect fit for elderly Hispanic women’s unique body chemistry. This is not always wrong (some antihypertensives have notably different efficacy in white versus black populations) but it is usually suspicious.
4. Test different conditions and report the ones you like. For example, suppose you are testing whether vegetable consumption affects depression. You conduct the trial with three arms: low veggie diet, medium veggie diet, and high veggie diet. You now have four possible comparisons – low-medium, low-high, medium-high, low-medium-high trend). One of them will be significant 20% of the time, so you can just report that one: “People who eat a moderate amount of vegetables are less likely to get depression than people who eat excess vegetables” sounds like a perfectly reasonable result.
Then they run simulations to show exactly how much more likely you are to get a significant result in random data by employing each trick:
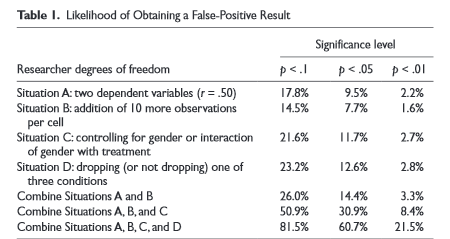
The image demonstrates that by using all four tricks, you can squeeze random data into a result significant at the p less than 0.05 level about 61% of the time.
The authors then put their money where their mouth is by conducting two studies.
The first seems like a very very classic social psychology study. Subjects are randomly assigned to listen to one of two songs – either a nondescript control song or a child’s nursery song. Then they are asked to rate how old they feel. Sure enough, the subjects who listen to the child’s song feel older (p = 0.03).
The second study is very similar, with one important exception. Once again, subjects are randomly assigned to listen to one of two songs – either a nondescript control song or a song about aging – “When I’m Sixty-Four” by The Beatles. Then they are asked to put down their actual age, in years. People who listened to the Beatles song became, on average, a year and a half younger than the control group (p = 0.04).
So either the experimental intervention changed their subjects’ ages, or the researchers were using statistical tricks. Turns out it was the second one. They explain how they used the four statistical tricks they explained above, and that without those tricks there would have been (obviously) no significant difference. They go on to say that their experiment meets the inclusion criteria for every major journal and that under current reporting rules there’s no way anyone could have detected their data manipulation.
They go on to list the changes they think the scientific establishment needs to prevent papers like theirs from reaching print. They’re basically “don’t do the things we just talked about”, but as far as I can tell they rely on the honor system. I think a broader meta-point is that on important studies scientists should have to submit their experimental protocol to a journal and get it accepted or rejected in advance so they can’t change tactics mid-stream or drop data. This would also force journals to publish more negative results.
See also their interesting discussion of why they think “use Bayesian statistics” is a non-solution to the problem.
II.
Second we have How To Have A High Success Rate In Treatment: Advice For Evaluators Of Alcoholism Programs.
This study is very close to my heart, because I’m working on my hospital’s Substance Abuse Team this month. Every day we go see patients struggling with alcoholism, heroin abuse, et cetera, and we offer them treatment at our hospital’s intensive inpatient Chemical Dependency Unit. And every day, our patients say thanks but no thanks, they heard of a program affiliated with their local church that has a 60% success rate, or an 80% success rate, or in one especially rosy-eyed case a frickin’ 97% success rate.
(meanwhile, real rehab programs still struggle to prove they have a success rate greater than placebo)
My attending assumes these programs are scum but didn’t really have a good evidence base for the claim, so I decided to search Google Scholar to find out what was going on. I struck gold in this paper, which is framed as a sarcastic how-to guide for unscrupulous drug treatment program directors who want to inflate their success rates without technically lying.
By far the best way to do this is to choose your denominator carefully. For example, it seems fair to only include the people who attended your full treatment program, not the people who dropped out on Day One or never showed up at all – you can hardly be blamed for that, right? So suppose that your treatment program is one month intensive in rehab followed by a series of weekly meetings continuing indefinitely. At the end of one year, you define successful treatment completers as “the people who are still going to these meetings now, at the end of the year”. But in general, people who relapse into alcoholism are a whole lot less likely to continue attending their AA meetings than people who stay sober. So all you have to do is go up to people at your AA meeting, ask them if they’re still on the wagon, and your one-year success rate looks really good.
Another way to hack your treatment population is to only accept the most promising candidates to begin with (it works for private schools and it can work for you). We know that middle-class, employed people with houses and families have a much better prognosis than lower-class unemployed homeless single people. Although someone would probably notice if you put up a sign saying “MIDDLE-CLASS EMPLOYED PEOPLE WITH HOUSES AND FAMILIES ONLY”, a very practical option is to just charge a lot of money and let your client population select themselves. This is why for-profit private rehabs will have a higher success rate than public hospitals and government programs that deal with poor people.
Still another strategy is to follow the old proverb: “If at first you don’t succeed, redefine success”. “Abstinence” is such a harsh word. Why not “drinking in moderation”? This is a wonderful phrase, because you can just let the alcoholic involved determine the definition of moderation. A year after the program ends, you can send out little surveys saying “Remember when we told you God really wants you not to drink? You listened to us and are drinking in moderation now, right? Please check one: Y () N ()”. Who’s going to answer ‘no’ to that? Heck, some of the alcoholics I talk to say they’re drinking in moderation while they are in the emergency room for alcohol poisoning.
If you can’t handle “moderation”, how about “drinking less than you were before the treatment program”? This takes advantage of regression to the mean – you’re going to enter a rehab program at the worst period of your life, the time when your drinking finally spirals out of control. Just by coincidence, most other parts of your life will include less drinking than when you first came in to rehab, including the date a year after treatment when someone sends you a survey. Clearly rehab was a success!
And why wait a year? My attending and myself actually looked up what was going on with that one 97% success rate program our patient said he was going to. Here’s what they do – it’s a three month residential program where you live in a building just off the church and you’re not allowed to go out except on group treatment activities. Obviously there is no alcohol allowed in the building and you are surrounded by very earnest counselors and fellow recovering addicts at all times. Then, at the end of the three months, while you are still in the building, they ask you whether you’re drinking or not. You say no. Boom – 97% success rate.
One other tactic I have actually seen in studies and it breaks my heart is interval subdivision, which reminds me of some of the dirty tricks from the first study above. At five years’ follow-up, you ask people “Did you drink during Year 1? Did you drink during Year 2? Did you drink during Year 3?…” and so on. Now you have five chances to find a significant difference between treatment and control groups. I have literally seen studies that say “Our rehab didn’t have an immediate effect, but by Year 4 our patients were doing better than the controls.” Meanwhile, in years 1, 2, 3, and 5, for all we know the controls were doing better than the patients.
But if all else fails, there’s always the old standby of poor researchers everywhere – just don’t include a control group at all. This table really speaks to me:
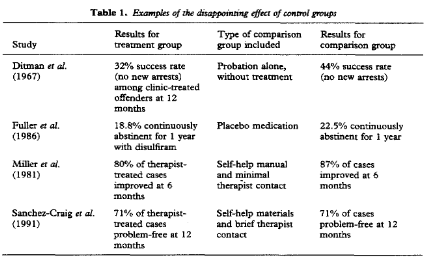
The great thing about this table isn’t just that it shows that seemingly impressive results are exactly the same as placebo. The great thing it shows is that results in the placebo groups in the four studies could be anywhere from a 22.5% success rate to an 87% success rate. These aren’t treatment differences – all four groups are placebo! This is one hundred percent a difference in study populations and in success measures used. In other words, depending on your study protocol, you can prove that there is a 22.5% chance the average untreated alcoholic will achieve remission, or an 87% chance the average untreated alcoholic will achieve remission.
You can bet that rehabs use the study protocol that finds an 87% chance of remission in the untreated. And then they go on to boast of their 90% success rate. Good job, rehab!





Personally, I think any discipline that uses surveys as data is not science.
That seems like an awfully stupid reason to discard a whole plan of research. What about survey data prohibits the scientific method from being implemented?
Any chance of cross-posting some of those really really excellent rationality-related articles to LessWrong? LW has apparently reached the stage that when I ask why the blog is so oddly inconspicuous I’m told that it’s so “boring and opaque” that it should be hidden away.
Obligatory xkcd reference
Thanks for pointing these out.
Most of these can be dealt with by proper replication. Unfortunately, few full scale replication attempts actually occur. Some of these are things that proper refereeing would notice. 1 for example- there are a lot of different standard metrics, so if the data they have only used one, a referee should ask “did you use the others? Why not?” Similarly for 3- one should when one sees something like that ask “So how many other groups did you use, or did you have a reason to look at this group in particular?”
That strategy actually seems like it could work, but almost seems like something referees do now, pressure authors to tell all the metrics they collected and tested.
The problem with the discussion (paragraph, really) of Bayesian approaches is that they don’t discuss the actual performance of the default WWAGD (what would Andrew Gelman do?) model as applied to their researcher-degrees-of-freedom scenarios. Researcher-degrees-of-freedom of types 1, 3, and 4 are all based on permitting one comparison to to stand out from the crowd entirely thanks to chance, and multilevel modelling (of any type; distinctions between Bayesian and frequentist approaches get a bit blurry) specifically mitigates that. That is, if you use such a model, comparisons that stand out from the crowd are far less likely to do so entirely thanks to chance.
I’m still thinking hard about optional stopping (type 2 researcher-degree-of-freedom).
Thanks– it’s good to have a compendium (incomplete?) of methods for cherry-picking data.
>”One of them will be significant 20% of the time, so you can just report that one: “People who eat a moderate amount of vegetables are less likely to get depression than people who eat excess vegetables” sounds like a perfectly reasonable result.””
This sounds a lot like the “Women who have more pre-marital sexual partners are more likely to fail at first marriage” graph from your anti-Reactionary FAQ.
Pingback: 7 Quick Takes (1/10/14)
Pingback: False-Positive Psychology
Pingback: Chronic Pain and Addiction « Econstudentlog
Pingback: Somewhere else, part 110 | Freakonometrics
How about manufacturing a false negative? They used to have two major categories of autism, late onset and early onset, but when they saw the need to censor the vaccination connection they started lumping them together because the late onset is so suggestive of standard vaccination schedules. Now that statistic is buried in noise.