From a recent Charter Cities Institute report:
From India’s independence from the British Raj in 1947 to the early 1990s, the country’s economic policy was largely socialist. In the 1980s some early steps were taken to open the Indian economy to increased trade, reduce controls over industry, and set a more realistic exchange rate. In 1991, more widespread economic reforms were introduced. These reforms included the end of government monopolies over certain sectors of the economy, reductions in barriers to entry for new firms, increased foreign investment was allowed, and tariffs and other barriers to trade were reduced or eliminated. After liberalization, exports increased substantially, and various service sector industries saw significant growth.
India’s growth has not just been good for the more educated segment of the population. Datt, Ravallion, and Murgai (2016) argue that India has made substantial progress in reducing the incidence of absolute poverty, and that this trend exists in both urban and rural areas. Historically higher rates of rural poverty have been converging with urban rates of poverty, and the overall poverty rate has been declining at an accelerating rate in the post-1991 reform era. In the 1970s over 60 percent of Indians were living in extreme poverty. As of 2011, only 20 percent of the population lived in extreme poverty. Between 2005 and 2016, an estimated 271 million Indians rose out of multidimensional poverty, which accounts for various health, education, and living standard indicators rather than just income (UNDP and OPHI 2018). Infant mortality has fallen from 161.4 deaths per 1,000 births in 1960 to just 32 deaths per 1,000 births in 2017, and India should soon converge with the world average if the current trend continues. Life expectancy has also improved dramatically, rising from 41 years in 1960 to nearly 69 years today. Like with infant mortality, India is close to converging with the world average in life expectancy. Literacy has improved from just 41 percent in 1981 to 72 percent in 2015, an increase of 75 percent. Here too, India is converging with the world average. Female literacy in particular rose from just 25 percent in 1981 to nearly 60 percent in 2011, and female primary school enrollment has increased from 65 percent in 1990 to over 98 percent today. Across the board of development measures, India has made tremendous strides.
Reading this surprised me. I was vaguely aware that India had done relatively well, but I didn’t grasp the scale. This should be up there with the rise of China as one of the most important (and most encouraging) news stories of my lifetime. And if it was really due to the 1991 reforms, they should go down alongside Deng Xiaoping’s liberalization of China as one of the century’s great achievements.
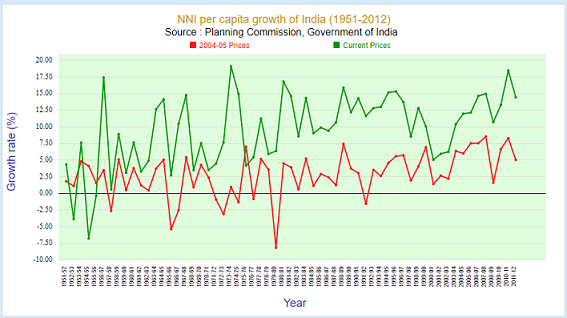
Looking into it further, the progress against poverty is on firm ground, but the attribution to the 1991 reforms is controversial. Here’s India’s rate of GDP growth over time:
And here’s its poverty rate over time:
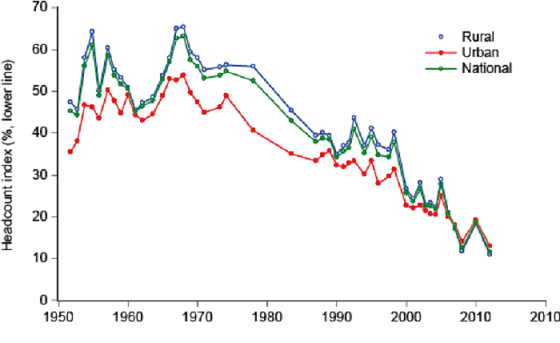
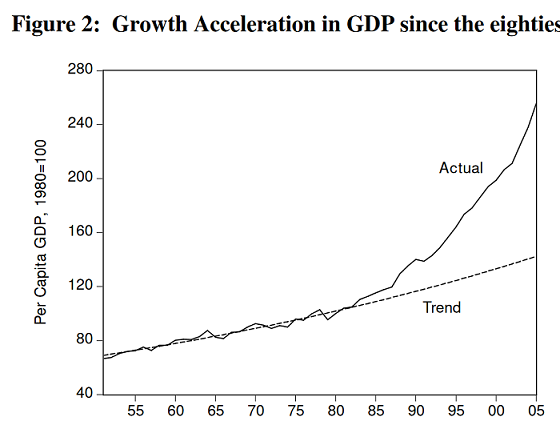
Neither looks like much happened in 1991. Both show, if anything, gradual progress from around 1980. Kotwal, Ramaswami and Wadhwa have an especially clear presentation of this:
For their claim about 1991, CCI cites Indian-American economist Arvind Panagariya’s 2004 paper. Panagariya is aware that the graphs don’t back him up, and cites other economists like Brad DeLong and Dani Rodrik making approximately this point. But he argues that liberalization deserves credit for India’s growth anyway, on two grounds. First, he says that there was “stealth reform” in the mid-1980s, when reformers opened the economy without publicizing what they were doing in order to avoid a crackdown from angry leftists. These were complete by 1987, leading to a boom from 1987 – 1991. Second, this growth was unsustainable, and ended in a 1991 crash. Only after the major 1991 reforms did India enter a sustained period of economic growth.
But Panagariya’s panegyric is founded on the growth starting in 1987; the graphs don’t support that story either. He can only note that:
It is difficult to pinpoint the timing of the upward shift in India’s growth rate. Thus, in a recent attempt to pinpoint structural breaks in the growth series, Wallack (2003) is able to achieve at best partial success. She finds that with a 90 percent probability the shift in the growth rate of GDP took place between 1973 and 1987. The associated point estimate of the shift, statistically significant at 10 percent level, is 1980. When Wallack replaces GDP by gross national product (GNP), however, the cutoff point with 90 percent probability shifts to the years between 1980 and 1994. The associated point estimate, statistically significant at 10 percent level, now turns out to be 1987.
In other words, statistics is hard, and random upward swings can segue into real changes in trend in hard-to-analyze ways. It’s impossible to say for sure from the GDP numbers that there wasn’t a (random) boom in 1980 that gradually merged with the (real) boom starting in 1987. This works with the GDP numbers, but I find it basically impossible to square with the graph on poverty (which is from 2016 and which Panagariya didn’t have access to).
CCI also cites Datt, Ravillion, and Murgal (paper, article), which claims that “economic reforms following the macroeconomic crisis of 1991-92 marked a significant change in India’s economic landscape, ushering in a new phase of high economic growth. The growth rate of NDP per capita more than doubled in the period since 1992.” But on closer inspection, they are just comparing an average for the period 1957 – 1991 with an average for the period 1992 – 2012, and finding the latter average is higher. They make no effort to establish that the break point is actually in 1991. Since people had been complaining about this for about ten years before the publication of their paper, I’m not sure what their excuse is, other than that they’re mostly making an unrelated point about poverty and this is not super relevant.
More recent work seems to agree that there is something fishy here. Agarwal and Whalley (2013) concludes that:
We do not find persuasive the contention of manyanalysts that growth accelerated after the mid-1980s when reforms were initiated. Nor does statisticalanalysis support the contention that reforms in the mid-1980s resulted in a growth acceleration. Weshow that there is an accelerating rate of growth of GDP after the mid 1970s and it is difficult to relate this gradual acceleration to specific policy changes. The changed policies in the 1980s did not meana basic change in the policy framework. Furthermore, since corporate investment as a share of GDP did not increase in the 1980s it is difficult to identify the mechanism by which the more pro-business policies of the government were translated to higher growth.
And Kotwal, Ramaswami, and Wadhwa (2016) says basically the same:
Formal econometric tests also indicate a structural break around 1980. Using an F-test, Wallack (2003) finds the highest value of the F-statistic in 1980. Rodrik and Subramanian (2004) use a procedure of Bai and Perron(1998, 2003) and they report a single structural break in 1979. Balakrishnan and Parameswaran (2007) also used the Bai and Perron procedure and they too locate a single structural break in GDP in 1978-79. The authors also estimate structural breaks for sectoral GDP. Their principal finding is that structural break in agricultural output occurs in the mid-1960s while it occurs in the early to mid-1970s for various sub-sectors of services. On the other hand, the first positive structural break in manufacturing occurs after the GDP break in 1982-83.
Basu (2008) and Sen (2007), however, point out that GDP fell by 5.2% in 1979-80 (due to a combination of a drought and the second oil price shock). If this outlier is disregarded, then the trend break occurs in 1975-76. The average annual growth rate during the period 1975-78 is 5.8% – a rate more in line with the post-1980 experience than with the earlier period.
Is the timing of the structural break important? The discussion in the literature about the structural break takes place in the belief that it could offer clues about what policies led to the shift in the economy’s growth rate. Such inference is problematic because statistical methods alone are unlikely to provide a precise timing. Judgments about outliers, the period of analysis, and the sectors that are considered, matter. An additional complication is that policy measures do not have instantaneous results. The delay would be especially pronounced if the benefits flow from a structural change. It is therefore unwise to correlate the changes in economic variables to the policy changes that immediately preceded them. These caveats notwithstanding, the economy does seem to have moved to a higher growth trajectory sometime in the mid to late 1970s or early 1980s, well before the economic reforms of 1991.
So what did cause the Indian economic boom, save 200 million people from poverty, and accomplish an almost unmatched victory over misery and mortality? After discussing a series of possibilities, Kotwal, Ramaswami, and Wadhwa…admit that they are confused:
Although it is clear that GDP growth rates increased sometime in the ‘70s or early ‘80s, the precise timing is hard to establish and depends on one’s prior. Various explanations have been proposed and it is impossible to be sure which of these is the most important one. The economic orthodoxy would favor one that credits trade liberalization, limited as it was, that decreased the cost of capital equipment but it is hard to disentangle the effects of this from more heterodox factors such as public investment and rise in savings rate (due to bank nationalization), the diffusion of agricultural technology (entirely due to public research and dissemination) or indeed to rule out the role of political attitudes towards business. It is also indisputable that there was an unsustainable fiscal expansion through 1980’s and any income growth resulting from it should be considered qualitatively different from the much more sustainable growth that occurred in the next decade.
Of the various papers they cite, the one I find most interesting is Rodrik and Subramanian (2004). After a while describing the problem, they look at it from a different angle: which Indian states boomed first? They find it was the states most closely allied with the ruling Congress Party, and tell a story where floundering Prime Minister Indira Gandhi decided she needed support from Big Business and adopted a pro-Big-Business attitude. They do excellent work establishing the plausibility of every link in the chain of assumptions here except the one where they admit that this attitude wasn’t reflected in any pro-business policies until the late 1980s at the earliest. Somehow Gandhi’s pro-Big-Business attitude is supposed to have helped business without being reflected in any major economic reforms. Maybe it changed the way existing laws were enforced? Maybe it signalled to businesses that they should get started on long-term strategies because they could expect favorable laws in the future? Or maybe Prime Minister Gandhi just sort of sat in New Delhi, telepathically willing Big Business to succeed, and it worked? Rodrik and Subramanian are kind of agnostic about this. Everything else seems to fit pretty well, though. This might be a good time to reread Does Reality Drive Straight Lines On Graphs, Or Do Straight Lines On Graphs Drive Reality?
This is also a good time to reread The History Of The Fabian Society, because the problem might be their fault to begin with. In the waning days of the British Empire, bright young leaders from all over the developing world (including India’s Jawaharlal Nehru) came to study at Oxford and Cambridge, got inducted into Fabian socialism, went home to their newly independent countries, and pursued socialist policies. All those countries did terribly and became the Third World basketcases of today. Only over the last few decades is the damage starting to be reversed.
If we had a better understanding of what exactly happened and how it was reversed, it could be an important source of information for developing countries in the future. Also, and more selfishly, it would be an important source of information for the US. Historically-informed anti-socialism arguments have tended to hinge on things like socialist China killing 60 million people, or socialist Russia killing 15 million people, or socialist Cambodia killing 1.5 million people, or [insert other socialist regimes killing 6-7 digit numbers of people]. But nobody thinks that Bernie Sanders plans to kill a six to seven digit number of people. To respond to Bernie-Sanders-style-socialism, we need to study and raise awareness of the history of democratic, comparatively “nice” countries that did nothing worse than overregulate business a bit – and investigate whether even these best-case scenarios still doomed millions of people to live in poverty. My (biased) guess is that careful study will show this to be true. But I don’t think this study has been done, I don’t think the facts are in yet, and I don’t think it was appropriate for the Charter Cities Institute to cite Panagariya’s argument on this point without any challenges or caveats.