
[Epistemic status: low confidence, someone tell me if the math is off. Title was stolen from an old Less Wrong post that seems to have disappeared – let me know if it’s yours and I’ll give you credit]
I almost screwed up yesterday’s journal club. The study reported an odds ratio of 2.9 for antidepressants. Even though I knew odds ratios are terrible and you should never trust your intuitive impression of them, I still mentally filed this away as “sounds like a really big effect”.
This time I was saved by Chen’s How Big is a Big Odds Ratio? Interpreting the Magnitudes of Odds Ratios in Epidemiological Studies, which explains how to convert ORs into effect sizes. Colored highlights are mine. I have followed the usual statistical practice of interpreting effect sizes of 0.2 as “small”, of 0.5 as “moderate”, and 0.8 as “large”, but feeling guilty about it.
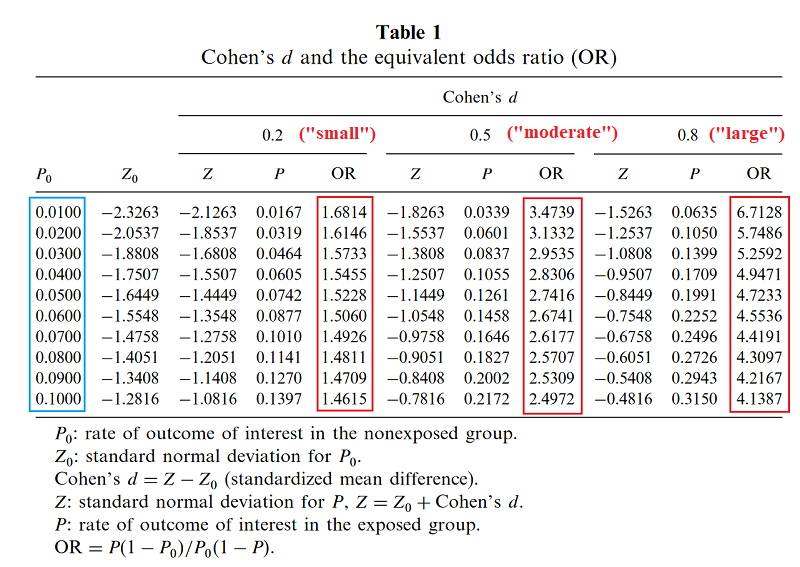
Based on this page, I gather Chen has used some unusually precise formula to calculate this, but that a quick heuristic is to ignore the prevalence and just take [ln(odds ratio)]/1.81.
Suppose you run a drug trial. In your control group of 1000 patients, 300 get better on their own. In your experimental group of 1000 patients, 600 get better total (presumably 300 on their own, 300 because your drug worked). The relative risk calculator says your relative risk of recovery on the drug is 2.0. Odds ratio is 3.5, effect size is 0.7. So you’ve managed to double the recovery rate – in fact, to save an entire extra 30% of your population – and you still haven’t qualified for a “large” effect size.
The moral of the story is that (to me) odds ratios sound bigger than they really are, and effect sizes sound smaller, so you should be really careful comparing two studies that report their results differently.


I think it makes no sense to think about small/moderate/large effect sizes without context. Imagine two treatments that make people grow 2 inches. One involves surgery and months of recovery. The other is a pill that, if taken daily, makes you safely grow two inches in two months (and then stops working). They both have the same effect size.
They both have an effect size of 0.71 (since the SD of height in men is 2.8 in). I agree that you would have to talk about the downsides and side effects of a treatment with effect size 0.71 before you could determine whether or not it was a good idea.
Wait… is it the SD of height in men that is important there, or is it the SD of change in height in the control group that would be important?
I’m with deciusbrutus — the pill doesn’t revert you to a baby and then stochastically regrow you to an adult, giving you another chance to roll high for height. Those two inches of growth should be compared to how much growth men in the control group experience, which is presumably an effect size in the hundreds or better.
Compare the observation I read long ago, that if you have a treatment that caused one person to regrow their missing arm, n=1 is a more than sufficient sample size, because the effect is so large. You wouldn’t say “this treatment gives you two arms; effect size is zero”.
Effect size is also strange when talking about a binary proposition, and “get better” is a binary proposition.
It could be that 30% of people have a spontaneous get better and 30% of people had half of a spontaneous get better, and the drug provided half of a get better to everyone; it’s also possible that 30% of people have a spontaneous get better and the drug gave 43% of people a get better.
Both of those would look the same if you only have ‘get better’ numbers, and if you reduce the final effect to one dimension you necessarily lose some of the nuance.
No. Whatever your intuitive thinkings, effect sizes as a meaningful statistical value are calculated a specific way to be interpreted properly, and that specific way for Cohen’s d is the SD of the variable in the sample, not the SD of the change.
The missing arm example is ridiculous because you’re not even applying the stats correctly. For one thing, obviously you don’t calculate a standard deviation for a sample of 1 to begin with because clearly there is no variance. And you don’t use Cohen’s d in a study design which has groups starting with different baseline measures of the variable (i.e. one group with one arm and a second group with two arms). You can’t disprove the validity of a statistical approach by applying it completely inappropriately.
I think it’s worth noting that just like statistical significance doesn’t denote clinical significance (and hence the use of effect sizes as well), effect sizes don’t have to denote the scientific significance of a finding. A treament that makes you taller would be scientifically ground-breaking, but if it only adds half an inch to your height, it’s still a small effect in the scheme of things given the variance of height in the population. What would such a treatment actually be used for in practice? This doesn’t mean effect sizes are broken, it just means you’re only meant to use them for the purpose for which they were designed to be used.
Yes and then arguably there is the related issue of what type of effect you are looking at. Are you looking at lifestyle drugs treating annoyances or is it life threatening diseases? In sum, it’s not just the relative benefit but also the absolute one ideally in relation to side AE, overall treatment burden AND the financial cost of the intervention.
I would wager that there will never be a single number to look at and decide whether something works, much less if it is worth it (for non trivial questions, obviously shooting people in the head has a fairly well defined effect).
Odds rations are wonderful tools for quantifying likelihoods of binary outcomes, building models, and making predictions. They are not useful for communicating the efficacy of a treatment or intervention to the general public or even to intelligent lay-people with passing familiarity with statistics. Actually, they’re not very useful for communicating in general except for people intimately familiar with math going on behind the scenes. This makes them similar to highly-technical jargon.
The issue you bring up of effect size is challenging. This relates to questions about the usefulness of terms like, “statistically significant”.
The problem is that every result you care about is context-dependent. Is an alpha-level of 0.05 the correct one to use? Depends on the context. Is 80% an adequate power for your experiment? Depends on the context. Is an intervention that doubles your success rate useful? Depends entirely on the context. (And not just what the initial rate of success was!)
When you study statistics, you learn about all of these things at a mathematical level, but the really good statistics programs will make sure you also understand how they relate and change within the context of specific data and problems.
(You probably got the title from this comment.)
The relative risk seems by far the most intuitive to me. If I understand it correctly, it can be interpreted as the ratio of the likelihood of recovery. In your example we have P(recovery|no treatment)=0.3 and P(recovery|treatment)=0.6, so the ratio (aka relative risk) is 2 (the second divided by the first). I find this 2 pretty intuitive: under treatment you’re twice as likely to recover.
And as we all know we should be sharing likelihood ratios.
Odds ratio = (likelihood ratio if positive) / (likelihood ratio if negative)
Odds ratios are fine!
The reason that they are hard to interpret is that they are prevalence-independent. But that’s good! A log-base-2 transform makes them into information content – they tell us how much information is provided by the test itself. This is extremely useful as long as you understand your starting point.
For instance, we could look at your drug trial in terms of information content :
Probability of recovery without the drug = 300/1000 = 0.30.
Odds of recovery without the drug = 0.43, which equals -1.22 Sh. This is our starting point.
Odds ratio of recovery with the drug is 3.5, which equals 1.81 Sh.
-1.22 Sh + 1.81 Sh = 0.58 Sh.
2^0.58 = 1.5, the odds of recovery with the drug. This equates to a probability of 0.6, or, 600/1000
The article you linked is only talking about scientific journalism. It’s not talking about actual research or regression, and in fact it supports the use of odds ratios as long as they are reported and understood properly.
That’s verifiable – the Matthews correlation coefficient is 0.30, indicating a moderate positive relationship.
No. You’ve saved an extra 15% (300/2000) of patients with the disease by treating 50% of confirmed cases.
I feel like “X is terrible because people who have no idea what it is will be confused about it” is pretty weak argument in general. If we chose publication standards based on what e.g. journalists were able to understand correctly, we wouldn’t even be able to publish papers on how to tie a shoe.
True. That said, odds ratios (ratia? ratioi?) are legitimately weird and non-intuitive, and people being confused by them is predicable; if you ever expect somebody who isn’t a statistician of some sort to read [thing], either including a different measure or a brief explanation seems like a pretty achievable goal.
If you’re looking for the plural of the Latin word, it’s rationes. (Compare “rational”.)
The English plural would be ratios.
The example at the end seems like a nice intuition pump for why you should feel guilty enough about the “usual statistical practice” to maybe actually stop doing it. Relative risk (same as likelihood ratio, right?) seems like the best measure in this case, and it’s quite high.
Did Cohen offer any sort of justification for these guidelines in his paper? Has there been any critical examination of the guidelines since?
I’ve noticed people have a “serious skeptical scientist” bias where, for example, they are more willing to suggest a study found a significant effect by chance than suggest that a failed replication occurred by chance.
In this case, if the Cohen’s d thing is pure tradition, maybe we should let math win over tradition? Maybe effect sizes of 0.2 shouldn’t be discounted?
After the contrarian wave of failed replications, I say we need a meta-contarian wave of “sometimes things actually work”. I mean, it’s obviously true that “sometimes things actually work” in the real world. Drinking water makes you less thirsty. It’s easier to get to sleep at night than during the day. What would the effect sizes be for these things if we did a study for them?
Years ago, we were discussing parapsychology as a negative control group for science. I say we need a positive control, too.
C-3PO: Sir, the possibility of successfully navigating an asteroid field is approximately 3,720 to 1!
Han Solo: Never tell me the odds!
…from The Empire Strikes Back
Worth noting is that odds ratios are always reported in case-control studies because relative risk is biased in this design, whereas the odds ratio is asymptotically unbiased. In case-control studies, calculated risks and relative risks are meaningless; the odds ratio is the best we have.
If the study is a drug trial, yeah, report relative risk. Save the odds ratios for when we don’t have something better. I’d say also report difference in proportion; relative risk can be deceptive too in that it’s sensitive to small changes when risk is low and insensitive when risk is high.
Also worth being clear on is that odds ratios cannot be converted to relative risks, or vice versa, without additional information. For instance, for the 300/1000 vs. 600/1000 example giving rr = 2 and or = 3.5, suppose we instead had 400/1000 for control and 700/1000 for treatment. Now, rr = 1.75 and or = 3.5. Odds ratio stayed the same, relative risk went down. If I only knew the odds ratio, I couldn’t get the relative risk.
And of course, we can leave relative risk the same and let odds ratio change. 100/1000 vs. 200/1000 gives rr = 2 and or = 2.25.
So, to “convert” odds ratio to relative risk, we first assume a proportion for one group (which, again, if it’s case-control then you don’t get to use the proportions from your data). I’d love to see “headline” odds ratios presented alongside a curve with baseline proportion on the horizontal axis and relative risk on the vertical. Then we could see just what that odds ratio implies about relative risk at any baseline proportion we’re interested in – and we could see how the implied relative risk falls as baseline proportion increases.
Maybe the best lesson is to report raw counts when possible. Since we seem to want to judge the interpretability of these statistics against our intuitions regarding the counts.
I was always told only to use OR when measuring time-to-event data, next seizure, MI etc.
Odds ratio = (likelihood ratio if positive) / (likelihood ratio if negative)
Accounts Payable