
Along with more specific questions, I asked people who took the SSC survey to rate their experience with the mental health system on a 1 – 10 scale.
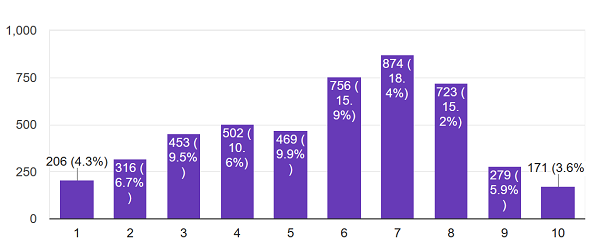
About 5,000 people answered. On average, they rated their experience with psychotherapy a 5.7, and their experience with medication also 5.7.
This is more optimistic than a lot of the horror stories you hear would suggest. A lot of the horror stories involve inpatient commitment (which did get a dismal 4.4/10 approval rating) so I checked what percent of people engaging with the system ended up inpatient. Of people who had seen either a psychiatrist or therapist, only 7% had ever been involuntarily committed to a psychiatric hospital. Note that this data can’t tease out causation, so this doesn’t mean 7% of people who saw an outpatient professional were later committed – it might just mean that lots of people got committed to the hospital by police, then saw a professional later.
Going into more detail about what people did or didn’t like (note truncated y-axis):
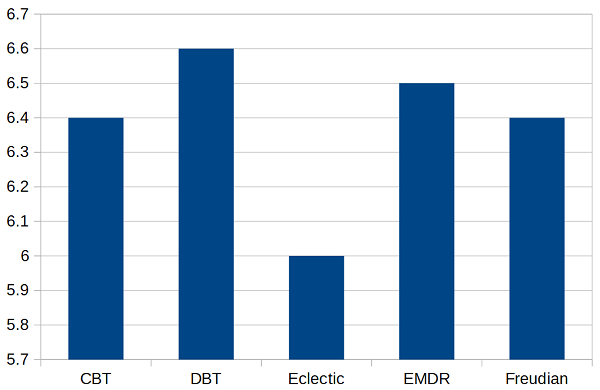
I asked people what kind of therapy they did. People liked all schools of therapy about the same, except that they liked “eclectic” therapy that wasn’t part of any specific school less than any school. Every school including eclectic got higher than 5.7, because people who wouldn’t answer this question – who weren’t even sure what kind of therapy they were doing – rated it less than any school or than eclectic therapy.
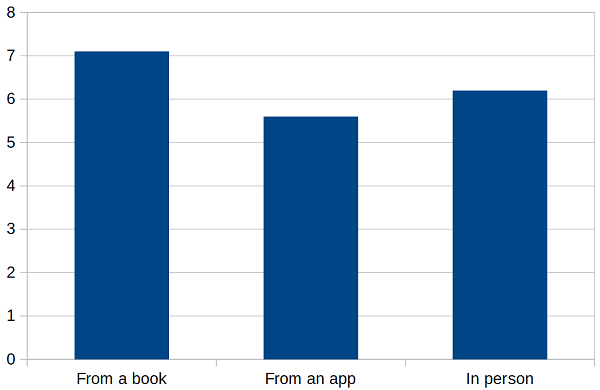
People really liked doing therapy from a book. They liked doing therapy with an in-person therapist a little less, and they liked online therapy apps least of all. This doesn’t match published literature, and this would be a good time to remember that all of these results are horribly biased and none of them can prove causation. For example, the sort of motivated go-getter who would go out and get a therapy book and read it themselves might be systematically different from somebody who gets therapy through an app or in a clinic.
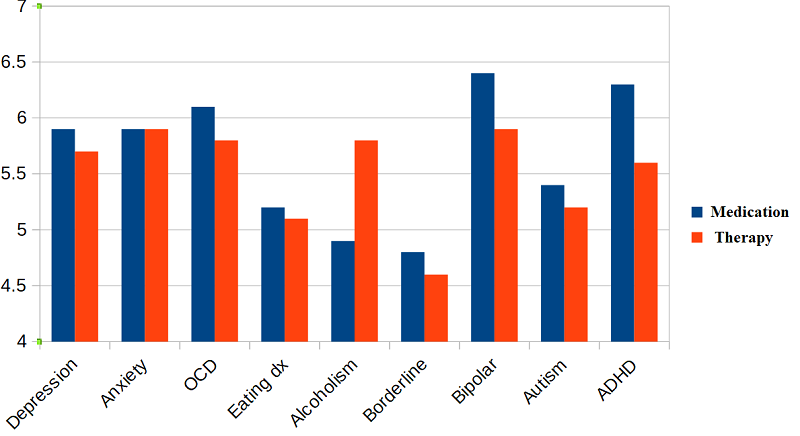
This graph shows how people liked medication (blue) and therapy (red) based on what their mental health issue was (note truncated y-axis). Some groups – people with eating disorders, people with borderline personalities – were just generally hard to please. Alcoholics were much happier with their therapy than with pharmaceutical treatment (though the sample size was only about 50 per group). People with bipolar and ADHD were happier with medication than therapy.
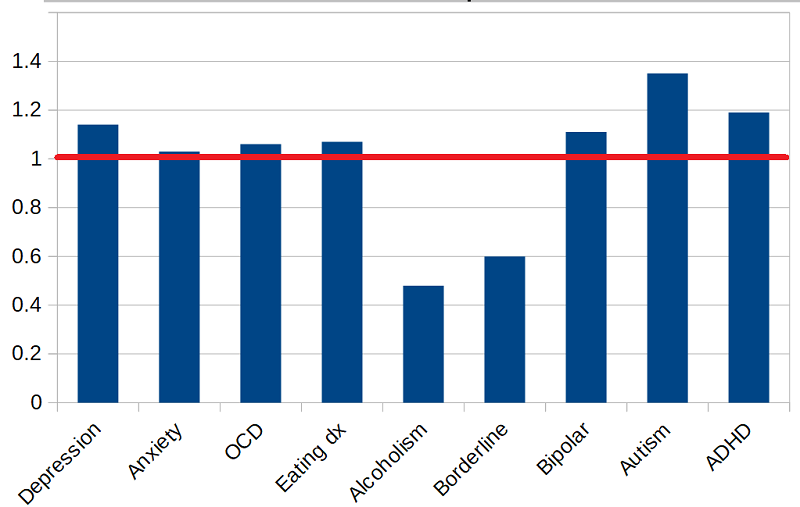
This is a little different. The last graph averaged everyone’s opinion of medication and everyone’s opinion of therapy. This one just includes the people who have tried both, who might have a better standard for comparison. The higher the bar above the red line, the more they preferred the medication; the lower the bar below the red line, the more they preferred the therapy.
Alcoholics and borderlines prefer the therapy. Autistic people strongly prefer the medication, which is weird because there’s no good medication for autism. This could be them hating the social interaction involved in therapy. Or it could be a condemnation of therapies like applied behavior analysis, which can become a sort of confrontational attempt to force them to conform, with potential punishment for failure. The ADHD preference for medication is less surprising; stimulants always get a high approval rating.
Remember, none of these numbers measure whether treatment works – just whether patients are happy. And they’re all vulnerable to selection effects and a host of other biases. Take them as exploratory only. I welcome people trying to replicate or expand on these results. All of the data used in this post are freely available and can be downloaded here.


Subscribe
I wonder if the age in which the person was in the mental health system matters; in particular, is the satisfaction different for minors (where the decisions are probably being made by their parents) vs. adults (who are more likely making their own decisions)?
I’ve recently been looking at the relationship between effective altruism and mental health; I analyzed a survey sent to EAs (https://forum.effectivealtruism.org/posts/FheKNFgPqEsN8Nxuv/ea-mental-health-survey-results-and-analysis), and I’ve compared that to the 2017 SSC survey, which showed a small and not significant correlation between EA ~ mental health condition. This year, the correlation is stronger, though I still can’t say anything about causality here with great confidence.
I particularly like that one wouldn’t expect people with mental health problems to answer the SSC Survey more often, as opposed to an EA Mental Health Survey, so the data you’ve made publicly available is useful. Less biased, or at least differently biased.
Without further ado, here is the breakdown of having a mental condition by affiliation to EA. For more elaborate stuff, follow the links.
## Diagnosed + Intuited

                                                                    Among those who answered "Yes" to the EA question: n =959

Has been diagnosed with a mental condition, or thinks they have one. n=580. As a percentage = 60.47967%

Has not been diagnosed with a mental condition, and does not think they any. n=347. As a percentage = 36.18352%

NA / Didn't answer. n=125. As a percentage = 13.03441%
Among those who answered "Sorta" to the EA question: n= 2223
Has been diagnosed with a mental condition, or thinks they have one. n = 1354. As a percentage = 60.908682
Has not been diagnosed with a mental condition, and does not think they any. n=795 As a percentage = 35.762483
NA / Didn't answer. n=167 As a percentage = 7.512371
Among those who answered "No" to the EA question. n= 4158
Has been diagnosed with a mental condition, or thinks they have one. n=2416 As a percentage = 58.104858
Has not been diagnosed with a mental condition, and does not think they any. n=1587 As a percentage = 38.167388
NA / Didn't answer. n=248 As a percentage = 5.964406
## Diagnosed
Among those who answered "Yes" to the EA question: n =959
Has been diagnosed with a mental condition. n=314. As a percentage = 32.74244
Has not been diagnosed with a mental condition. n=613. As a percentage = 63.92075
NA / Didn't answer. n=125. As a percentage = 13.03441
Among those who answered "Sorta" to the EA question: n= 2223
Has been diagnosed with a mental condition. n=718. As a percentage = 32.298695
Has not been diagnosed with a mental condition. n=1431. As a percentage = 64.372470
NA / Didn't answer. n=167. As a percentage = 7.512371
.
Among those who answered "No" to the EA question. n= 4158
Has been diagnosed with a mental condition. n=1183. As a percentage = 28.451178
Has not been diagnosed with a mental condition. n=2820. As a percentage = 67.821068
NA / Didn't answer. n=248. As a percentage = 5.964406
For some regressions and some plots of the above, see https://nunosempere.github.io/ea/EA-MH-SSC-2019-Survey on my github, or here: https://forum.effectivealtruism.org/posts/FheKNFgPqEsN8Nxuv/ea-mental-health-survey-results-and-analysis#uXdPTjJvpwKCKErp4 for some context in the EA Forum.
So, altruists are crazy? I thought that had already been established 😉
Now, are EFFECTIVE altruists more crazy than ineffective ones? That’s the useful question.
Since he’s polling crazy people, what difference does it make what system of error bars he uses? 😉
Seriously, polling the victims is not a method of finding out what systems work. If people chose the right systems themselves they wouldn’t end up labeled as “mentally ill” and then targeted for personal destruction.
As Scott said a couple years ago, a lot of “mental illness” is just being poor and running afoul of the wrong “professionals”. (And conversely, there are plenty of real nuts that just happen to be rich and powerful… so we pretend that they are making sense.)
Rich and poor people may be equally crazy. But if rich people can afford whatever means are necessary to live a functional life, while poor people end up on the street or in prison or dead, then poor people are “mentally ill” in a way that rich people are not.
7% of all people who see a psychoanalyst or therapist having been involuntarily committed seems absurdly, alarmingly high to me. Why is this described as “only”?
Tangential to this, a story from The Sun (which, it being the Sun, is not going to be the most rigorous of journalism) about how prescription form (nasal spray) of ketamine to treat depression may be approved in the UK.
The piece says that this already exists in the USA under the brand name Spravato. Now, in previous discussions on here about ketamine for depression, I don’t recall hearing about this – is it true?
EDIT: Looking it up online, it seems approval was only requested late last year and happened early this year, so maybe general awareness of this being available isn’t widespread yet. The cost also seems eye-watering (“The cost of the nasal spray as of 2019 will be US$4,700 to $6,800 for the first month”) and I have to imagine the NHS is going to strike a better deal than that if it’s going to cover it for treatment-resistant depression patients on a wide scale.
EDIT EDIT: Another story says that the sticker price isn’t necessarily what patients will pay (it’s in the more reasonable ‘hundreds rather than thousands’ range) depending on insurance plan etc. etc. etc. and I have to say, whatever about healthcare reform in the US, it seems to this uninformed person that your first badly-needed step would be to have drug companies QUOTE A FLIPPIN’ STANDARD PRICE for their drugs, not “we’ll look for X thousand but we fully expect you to haggle us down to Y hundred” carry-on.
Imagine going to buy a car, and the first thing is “oh yeah, this will cost you $50,000. Except if you buy it from this authorised chain of dealers, it’ll only cost you €25,000. And if you get a voucher scheme, you could get it from as little as $10,000. Only thing is, if you go to a different dealer, you’ll be charged the full $50,000 but we’re not gonna tell you which dealers are which, you have to figure it out for yourself and if you pay full whack we all think you’re a sucker. What you need to do is get your employer to pay into a plan for your automotive needs”. Hospitals seem to be even worse with “and on top of the fifty grand, we’ll charge you for each individual wheel, and if you’re expecting a steering wheel that will be extra as well, and and and…”
I don’t think that model of business would survive, and yet health insurance and hospitals seem to run happily on that very model!
Only? This seems scarily high to me. If I go see a therapist I have a ~1/12 chance of being involuntarily committed to a psychiatric hospital? Uh, no thanks…
Read the next sentence 😉
We can’t tell because of the way the data was collected, but I would guess almost none of that 7% were involuntarily committed as a result of visiting a therapist (not counting people who went in seeking an evaluation so that they be committed). Your chances of being involuntarily committed because you visited a therapist approach 0. Involuntary commitments are almost always the result of police responding to a call.
FWIW in my non-representative life on the ambulance: I’ve taken many people from home to a psych facility for involuntary and “voluntary” assessments. I’ve taken a small handful from hospitals to psych facilities. But I’ve never taken someone from a therapist’s office for any form of assessment.
I would guess that someone who is ready, able and willing to see a therapist on an out-patient basis would be viewed as on the lower end of risk.
Any interpretation of the responses of autistic people should factor in the fact that the subset of people in this category are both self-identified and by definition functioning well enough to meaningfully fill out the survey.
ABA may very well be harmful for autistic people functioning at that level when negative reinforcement is used or the therapy is otherwise poorly performed.
However, for lower functioning autistic people, ABA and its evolved variants are often a dramatically effective educational technique that can help impart skills that would be almost impossible to teach in other ways. There are no effective substitutes for it — certainly no pharmacological ones — in the education of people with lower functioning autism.
Silly question, but how different is ABA from childhood bullying? I don’t mean that negatively. I mean that what I see as bullying is mostly negative reinforcement applied to non-conforming members as an emergent property of society. ABA is obviously done with the best of intentions and bullying not so much. But might the methods and complying with cultural norms be substantially similar?
In my experience, ABA focuses on differential positive reinforcement for reduction of behaviors, rather than punishment or negative reinforcement. If bullying is negative reinforcement applied to coerce desired behavior, what I’ve seen of ABA and what the literature describes as approved ABA technique is primarily positive reinforcement applied to teach communication and play skills.
Not to say that you can’t use behavioral techniques to bully or push compliance with cultural norms, but that’s not ABA as described or (as I’ve seen) practiced.
It’s the difference between teaching a dog to communicate when they need to go outside and just beating the same dog every time you catch them eliminating on the carpet.
When done properly, that is.
I’m also not really convinced that all bullying is the result of non-conformance. Or that, in the cases that it is, that the conformance is in the best interest of society or the person being bullied. Theoretically (as you say, if done properly) ABA would be both of those.
Yes, most bullying is done merely to convey the fact that the bully has sufficient power to get away with it and the victim lacks enough to stop it.
It seems suspicious to me to make the argument “the autistic people who can talk tend to have at best mixed feelings about ABA and at worst PTSD from it, but actually it’s great for the ones who aren’t capable of offering a verbal opinion.”
Like, I’m not saying that your argument is necessarily wrong. Just kind of suspicious.
Particularly when combined with a baffling lack of concern about the PTSD, which naively seems like a pretty major adverse event report, and the fact that zero effort is made to ensure that ABA is not provided to children who are likely to grow up to be “high functioning.”
I think ABA may have changed a lot since it was first developed. I have no clue what it currently looks like for older kids or adults, but my 2.5 year old gets two hours of ABA therapy in our home every day, so I have a lot of opportunity to observe it, and I don’t see how it could possibly be traumatic. It’s basically like preschool but with all the emphasis on social skills: they have a gigantic bag of toys and play whatever my son likes, sort of “playing dumb” and stopping the action if he stops actively participating (for example, he loves all the songs, but would prefer to just watch the therapist sing them, so if he stops singing along or doing the accompanying hand gestures, they will stop and wait for him to join again). It’s as non-coercive as I can imagine it’s possible to be while still requiring social engagement from him. There is no punishment if he doesn’t interact as desired; he’s motivated to jump through their hoops, so to speak, by his desire to play the fun games on offer.
What are self-therapy books? Are there any particularly popular ones?
Off the top of my head, I can think of the CBT workbook, which is a companion to Cognitive Behavior Therapy, and can be used without an actual therapist.
I think looking at the 20% of the sample that rated their experience 1-3 would be the best place to start in improving people’s satisfaction with care. You’re thrice as likely (on priors) to have someone rate your service that poorly than for them to be involed.
I’m a little surprised it was even that high.
I agree, I assumed it would be much, much further below the general experience approval rating
I can’t remember, was the survey question about involuntary commitment only, or did it include voluntary rehab? If the latter, maybe it is skewed positive by people going to the big bucks rehab resort type places?
Yeah, the question was about both voluntary and involuntary inpatient experiences: https://slatestarcodex.com/blog_images/DummySurvey.html
Even still it’s surprising to me
In my time with EMS I’ve transported a few people to psych facilities. Though they’ve all been in good shape (ie clean, well-lit) there’s something unpleasant about them. I’ve yet to find one I might actually enjoy being in.
This is in contrast to a number of the standard hospital rooms I’ve been in which I wouldn’t mind a week’s stay. And some of the labor and delivery suites are very nice. But psych facilities? Nope.
I have been in two quite unpleasant institutions, one relatively pleasant one, and tried (and failed—long story) to get myself checked into another one which seemed pleasant from what I saw. I think there are some nice ones, but they skew gloomy and unpleasant.
I’ve been a visitor to a couple of different in-patient psych facilities a few times, and I’ve checked someone into one once.
Yeah.
They were all clean, well lit, and generally on the surface-comforts nicer then the other inpatient facilities in the same hospitals.
But there was… something… wrong.
I think staying there would MAKE people crazy.
Autism and medication: how many of those people have something that is medicatable as well? AFAICT it’s pretty common for some SSRI-treatable anxiety or depression to be present too – maybe people are happy with their medication for that.
That was my first thought as well.
That was my first guess, but really that’s probably more about me personally than autistic people in general.
On the other hand, as applied, I haven’t really minded social interaction with therapists, possibly because it’s their job to be personable.
Of two experiences:
– In elementary school, I was assigned a therapist for some reason unknown to me. I saw him once a week and we played board games. I don’t recall talking about anything, though it must have happened (?). I would call this a pretty unambiguously positive experience, although if I had to pay for it that would change things.
– In high school, I saw a therapist who was also seeing a friend of mine. After a few sessions, he asked me about a person I had never mentioned to him. I was shocked and never went back.
And I guess that’s what therapy means to me in terms of lived experience. :-/
psychview_therapyschool.png should show a larger range on the y-axis IMHO. 4-7 like psychview_comparison.png would do nicely, but as it is it visually suggests differences between therapies other than eclectic and that’s probably just noise. I’m aware this is addressed in the text.
The obvious confounder in book/app/in-person ratings, is that this is a sample of people who chose to read a psychiatrist’s blog, which is vaguely similar to reading a therapy book.
I don’t think that’s a big concern here. It’s not like Scott is posting about treatment techniques or workbooks to help your mental health. Other than the general intelligence/pro-reading bias here I doubt this makes much of a difference.
I think the FAR larger confounder is the fact that you aren’t likely to say you do book therapy if you once bought a therapy book to try it and set it down after an hour. So the people who say they do book therapy are almost all the people who feel it is working for them.
On the other hand, going to a therapist is both the socially default answer of what one should do and something that people are much less likely to set aside quickly if they don’t see immediate results.
Typo: treamtent
Also I’m curious what you think about the relative popularity of therapies that you see as non-evidence based (Freudian) and the relatively tiny superiority of medication over therapy in depression.
Your quite bullish about the efficacy of SSRIs in clinical practice so what do you think the relatively small margin for medication here reflects. Especially given that even therapies you see as unsupported (Freudian) seem to be rated highly. Do you think it’s one of the following or something else?
0) People’s difficulty judging effect of meds on themselves (favorability here may reflect how rewarding the med is not long term effects which people credit to external factors).
1) People’s personal relationship with a therapist making them inclined to say positive things about them (potentially giving a boost to therapies that feel more intense…potentially Freudianism).
2) Actual benefits to the personal interaction.
3) Difficulty matching patients to medication or time to take effect (many people get better after a few months and so may not be in contact with treatment long enough).
4) General dislike of being on medication.
The relative popularity of therapies, at least, isn’t a new or surprising result – it’s just the dodo bird verdict seen from the angle of patient attitudes.
That’s a good point but it doesn’t really explain why eclectic does so comparatively bad.
“The Dodo bird debate only took flight in 1975…”
A turn of phrase I would not have expected from Wikipedia
Especially since dodos were flightless.
Small correction: in the first plot with medication vs. therapy borderlines prefer medication slightly, in the second they prefer therapy strongly. This isn’t a contradiction but is odd.
Do you think the dislike of medication for alcoholism reflects people who are prescribed antabuse? Or nalaxone? I mean both make you feel worse in some way rather than directly fixing something even if they can better a life.
Sometimes people even have legal or medical treatment reasons that semi-coercively require them to take it (e.g. as a condition of legal deals or even as a condition of some kind of treatment.
Personally, I have strong reservations about using nalaxone in treatment since I fear it interferes with endogenous opiates without substituting any other agonist (as in buprenorphine etc..).
I’d love to see people’s satisfaction level with treatment for opiate addiction.
On the off-chance of being pedantic – could you include some error bars on graphs like these? Ideally, 2*standard error of the mean [ = 2 * standard deviation / sqrt(N) ]. Yes, this assumes normality to interpret properly, still better than nothing.
Why not just plot 95% confidence interval error bars instead of using an approximation? I don’t get why the indirect method would be better here.
I believe the data is available (I know some is and this probably is too) so it probably wouldn’t be hard to do this yourself and post a link for the rest of us.
I mean it’s a reasonable thing to want but I presume Scott has things to do too.
I think a box-and-whisker plot would work well for this kind of data. They’re quite easy to make (at least in R with ggplot2).
Fair points.
+/- 1.96 * SD / sqrt(N) would be precisely the CI for normal and easy to do in Excel. We could have a discussion on proper CI (need to know distribution) or IQR/boxplots, but my feeling is that’s going beyond just giving us some idea on variability.
I’d be happy to give ‘regraphing’ a try, any suggestions for where to host the figures? (I don’t have much experience with it).
I use imgur. I don’t even make an account.
IQR is simpler than SD!
I guess my comment was a non sequitur, confusing the distribution with the standard error. But I think metacelsus is correct that it is more useful to plot some representation of the distribution than the confidence interval. I’m not sure IQR is so good for such coarse discrete data, though.
“proper CI” seems to be a reference to Nabil. I think he is advocating the nonparametric bootstrap. Pretend that the true distribution is uniform over the sample. The standard deviation of the sample distribution is just an approximation to the actual sample distribution, so you’re just approximating the bootstrap anyhow. (Or you’re assuming that everything is normal, but since the data is discrete, that’s absurd.)
Keeping my promise to myself here they are: figures above, with +/- 1.96*SEM error bars: https://imgur.com/a/XpEjQRs
In short: public dataset is smaller, so some categories were excluded (in particular, in medication/therapy figure). IQR isn’t that informative, as scale is small and most answers have similar modes. Cosmetics could be better.
One issue: depending on whether I use “Overall Mental Health (Therapy)” or “Therapy Overall” score, I get a different answer to “which therapy school is best”. Either “eclectic” is not as bad, or “no answer” is pretty average.
Less than 10% respondents used book/app/other in therapy, as opposed to having a face-to-face with a therapist.
Interestingly, distribution of scores for therapy satisfaction is bimodal, suggesting it essentially boils down to “helped / didn’t help” (or equivalent binary). Can’t be bothered to replot everything with that in mind.