
[Epistemic status: low. You tell me if you think this works.]
Commenter no_bear_so_low has been doing some great work with Google Trends recently – see for example his Internet searches increasingly favour the left over the right wing of politics or Googling habits suggest we are getting a lot more anxious.
I wanted to try some similar things, and in the process I learned that this is hard. Existing sites on how to use Google Trends for research don’t capture some of the things I learned, so I wanted to go over it here.
Suppose I want to measure the level of interest in “psychiatry” over the past few years:
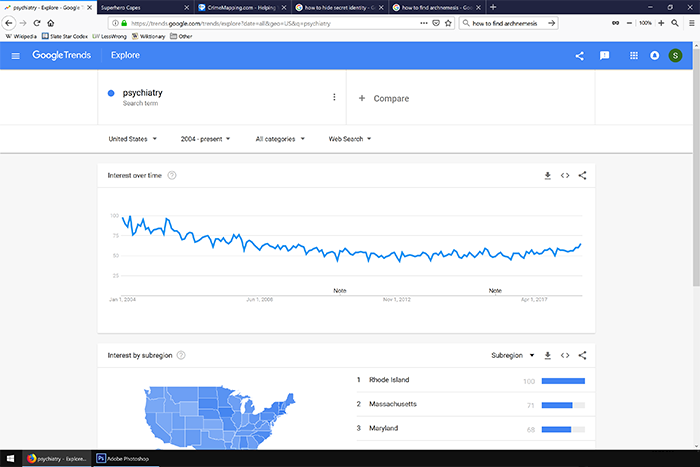
Looks like interest is going down. But what if I search for “psychiatrist” instead?
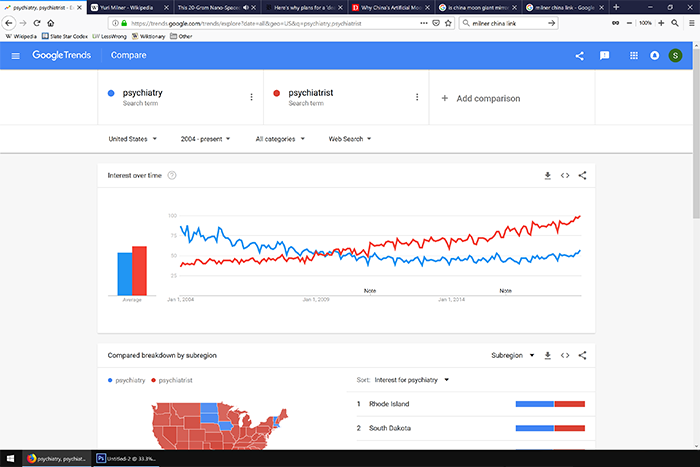
Uh oh, now it looks like interest is going up. I guess what I’m really interested in is mental health more generally, what if I put in “suicide”?
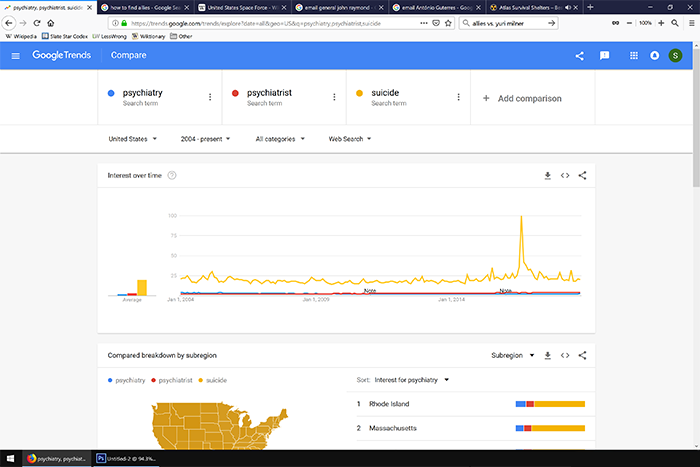
Now everything else is invisible, and the data are dominated by a spike in August 2016, which as far as I can tell is related to the release of the movie “Suicide Squad”.
I could try other terms, like “depression” and “anxiety”, but no_bear’s data already tells us those two are moving in opposite directions. Also, depression has a spike in late 2008, which must be related to the stock market crash and people’s expectations of an economic depression. This doesn’t seem like a great way to figure out anything.
I wondered if averaging a bunch of things might take away some of the noise. I chose nine terms that seemed related to psychiatry in some way: psychiatry, psychiatrist, psychotherapy, mental illness, mental health, suicide, depression, antidepressants, and anxiety. Google won’t let you combine that many terms in a single query, but that’s okay – I don’t want to see them relative to one another, I just want to get standardized data on each. There’s a button to download any individual Google Trends query as a spreadsheet:
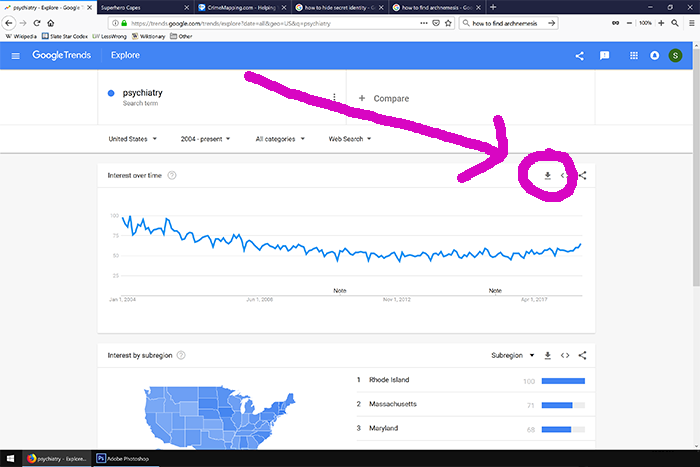
Don’t do this with a comparison graph like the last one. Otherwise you’ll get everything standardized relative to each other, and you won’t be able to compare different sets of multiple queries. Do it for a single trend line, do it a bunch of times, and then manually copy-paste all of them onto the same spreadsheet.
When I average all nine of those search terms, I get the following plot:
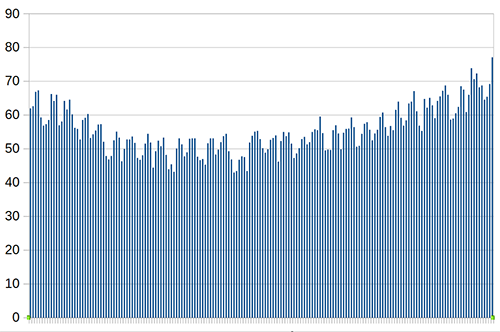
…which at least looks a lot simpler and more informative than most of the individual ones, and which doesn’t have any big spikes for movie releases or anything. It also doesn’t seem very sensitive to any small changes; when I take out the most dramatic outlier, anxiety (which has been increasing worringly fast; see no_bear_so_low’s article above for more), it changes to this:
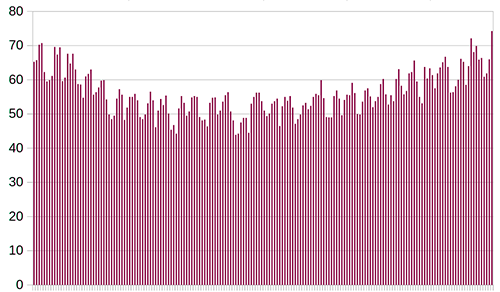
If you look really closely, you can see these are different graphs, but it sure isn’t a big difference.
These both have a kind of regular sawtooth pattern with a six month cycle; the peaks are always around April and October, and the valleys are always around July and December. These correspond nicely to school terms and vacations. While it’s possible that school is stressing people out and making them more worried about their mental health, you get these peaks in almost every field that anyone might study in school; I think it’s more likely that psychology students are looking these things up as part of their schoolwork.
Can we trust this? Can we do better than this? I imported these to SPSS and made a table of the correlations between each of the nine terms:
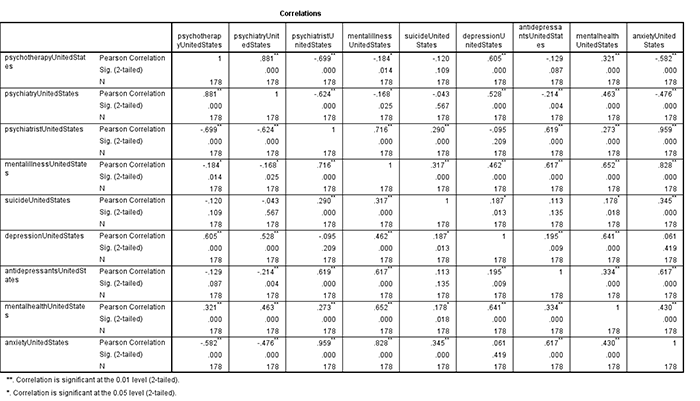
A lot of things are negatively correlated. I don’t trust the coefficients and significance numbers much – I think they’re just temporal autocorrelation – but it’s kind of disturbing to see so many things going the opposite direction. Then again, we already knew this from the first psychiatrist-vs-psychiatry graph. I don’t know what I expected to see here and maybe this was a stupid thing to even investigate.
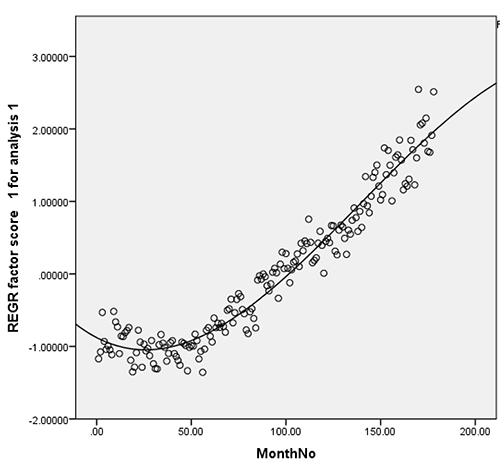
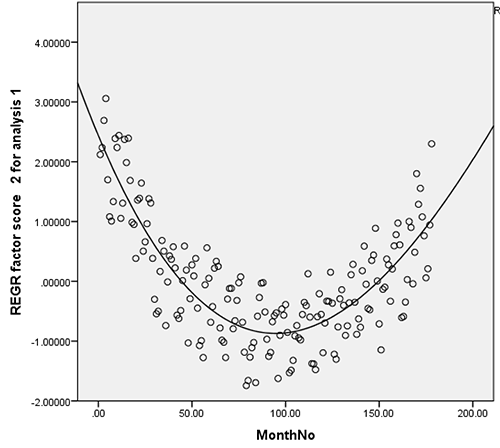
Maybe a factor analysis would be more illuminating. Here’s what I get:
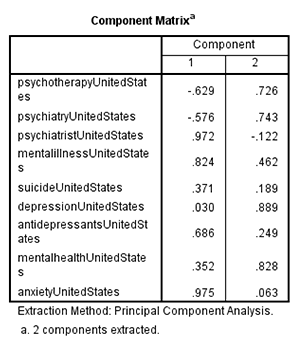
This is pretty weird, but here’s how I interpret it. One factor is students with an intellectual interest in mental health – maybe they’re studying it, maybe they want a job in it. They Google things like “psychiatry” to learn about what psychiatry is and whether it’s a good career path. This has been going down over the past decade – I’ll talk about why this might be towards the end.
Another factor is people with mental health problems. They Google things like “psychiatrist” to try to find psychiatrists in their area, or “antidepressants” because they want to know if antidepressants will work for them. This has been going up over the past decade as more people worry about mental health problems.
On the other hand, maybe we can’t do this, because of the temporal autocorrelation. Maybe this is just giving us a List Of Things That Are Going Up and another List Of Things That Are Going Down. I don’t know how to solve this problem.
But in favor of this interpretation, consider:
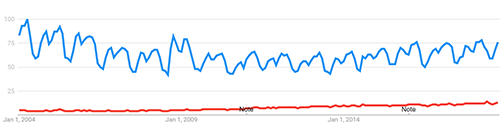
The blue line is “depression”, the red line is “depressed”. As predicted by the two-factor theory, “depression”, the very intellectual term that a student might type in to do their homework, is going down. “Depressed”, as in “help i am depressed”, is going up. “Depression” shows a strong school-related sawtooth pattern; “depressed” does not (it’s not just because of the different scales on this image; even a search for “depressed” on its own does not demonstrate the pattern).
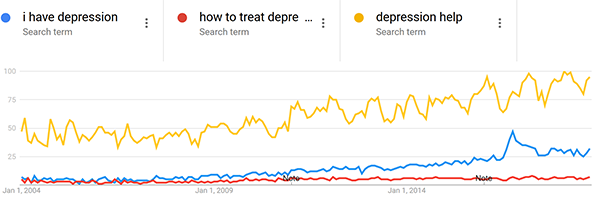
Also consistent with this theory, “how to treat depression”, “depression help”, and even “i have depression” are all going way up.
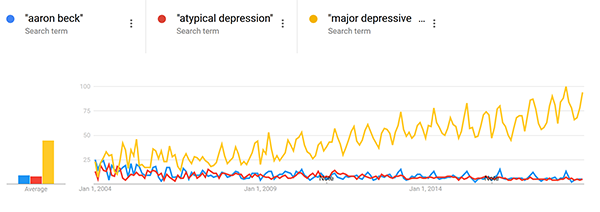
Contrary to my theory – “major depressive disorder” (an overly formal way of referring to depression, mostly of interest to psychologists and psychiatrists) is going up. But “Aaron Beck” (a famous depression researchers whose work is often taught in school) and “atypical depression” (a subtype of depression mostly of interest to psychologists and psychiatrists) are going down.
And compare “anxiety help” vs. “generalized anxiety disorder”.
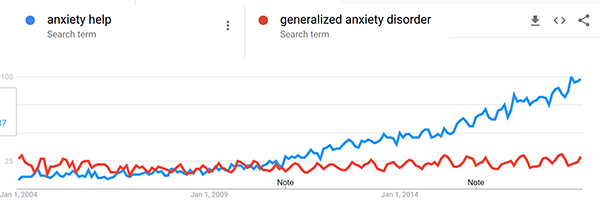
Although it’s not perfect, I think this explains a lot of these seemingly contradictory results.
Here is a graph just showing just the factor which I think corresponds to something like “people with mental health issues”:
And here’s one just showing just the factor which I think corresponds to something like “students with an intellectual interest in psychiatry”:
I originally hoped this would explain no_bear_so_low’s main finding of anxiety (but not depression or other psychiatric conditions) increasing, on the grounds that “anxiety” searches are driven by anxious people, but “depression” searches (as opposed to “depressed” or “suicidal” or “sad”) searches are driven by students. This doesn’t work. There’s a slight trend in this direction, but not nearly enough to explain the disproportionate rise in anxiety.
Does the second factor indicate declining interest in psychiatry as a field? I originally thought it might not. 2004 was a long time ago. The 2004 internet, compared to the modern internet, was dominated by smart technophile early adapters and university students. So it could be that smart people remain interested in intellectual fields, but are gradually being diluted as a percent of the Internet’s user base. This could also explain the rise in Factor 1, if technologically-adept college-educated people have fewer psychiatric issues than other people.
I don’t have a really principled way to test this, so I just threw in a whole bunch of intellectual terms that I expected intellectual and college-educated people to search for and which I wouldn’t have expected to change much over the past decade. I tried to do five terms from five different fields of study, though due to computer error only three of the biology terms ended up included and I didn’t want to repeat the whole thing. Here’s what I got:
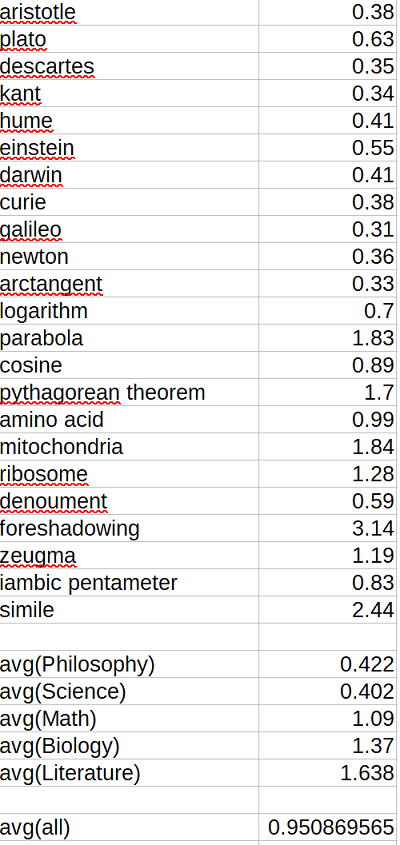
The number is (popularity over last twelve months)/(popularity over first twelve months), approximately (2018 popularity)/(2004 popularity). Although there are a few dramatic trends – fewer people interested in philosophers, more people interested in the Pythagorean Theorem – overall there is no sign of an intellectual decline.
Likewise, for non-intellectual subjects beloved of the unwashed masses:
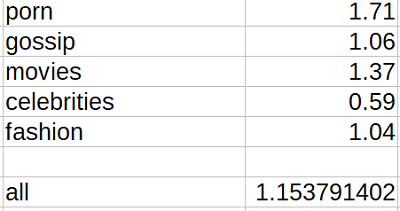
Again, a few things are going up, a few things are going down, but there is little sign of a general increase.
So here are my tips for researching things with Google Trends:
1. Individual keywords may be relevant for very some specific searches (eg “obama”), but can be dangerous when looking at broader trends. For example, “psychiatry” and “psychiatrist” have gone in opposite directions since 2004.
2. Averaging large numbers of related keywords might help with this problem, but can cause issues of its own.
3. Factor analysis might help with averaging large numbers of related keywords, especially in generating new theories and intuitions. I don’t know whether temporal autocorrelation makes it useless or dangerous.
4. If you see a sawtooth pattern with troughs during school vacations, this can help you figure out whether you’re looking at students or at “organic” results. The higher the peaks and troughs of the sawtooth, the more your data are skewed towards student searches.
5. Surprisingly, there doesn’t seem to be a clear need to adjust your data for a general intellectual decline in the Internet.


Small typo: “2. Averaging large numbers of related keywords might help with this problem, but can issues of its own.” You probably meant to have a “cause” between “can” and “issues.”
You switch your definitions of factors 1 and 2 part way through the article.
But later:
The first factor reflects topics with an annual cycle vs those without. That’s great. But now that you know that, you probably shouldn’t look at the second factor. The second factor combines the structure of the set of annual topics with the structure of the set of continuous topics. Potentially there is value in averaging between both sources of information. But if you’re pretty sure that it’s school vs not-school, you should probably throw out the school topics and look at only the non-school topics. Maybe you should do factor analysis on them, but probably not in conjunction with the school topics.
Does anyone else notice the titles of the browser tabs open in those images?
For example, on the first one: “superhero capes” “crime mapping” “how to hide secret identity” “how to find archnemesis”
Quite funny.
Screwing with one’s tabs for amusement (check the space-related ones as well) is a venerable source of humor and dates from 4chan posts in which someone would inadvertently leave hentai tabs or other weird searches in screenshots. Intentional trolling of this nature shortly followed. Using the technique for xkcd-style humor is relatively new.
I notice that a lot of the tabs are Google searches. The natural next step is to track the development of this humor with Google Trends.
An interesting question is to what extent we should be brushing off the ‘merely academic’ study of these topics. One can imagine that interest in these fields is in some ways related to a person’s individual mental health, or some overall cultural zeitgeist.
Also consider changing internet demographics. Terms like “programming” and “Linux” keeps going down. Neither of those have become less popular, but the proportion of internet users who cared about them was a lot higher in 2004.
This could explain the declining numbers for psychiatry. Internet users in 2004 were more young, educated and high socio-economic status. All make you more likely to be a psychiatry student or similar.
this is so important!! it is the most fatal flaw
The bias is in the other direction. Early internet was incredibly biased towards linux, much more so than other intellectual pursuits.
I used linux and programming as extreme examples, but the internet was generally more academic back then. I’m not sure what you mean by “other direction”.
I wrote about this in 2014, and it will be even more relevant now as Internet is not only available to more people but in more regular use by very different demographics including quite small children.
https://thomasthethinkengine.com/2014/02/07/the-decline-of-economics/
I still love to use Google Trends but sadly its power is limited!! Best for short-run comparisons.
I had a very long conversation with a friend who’s in a PhD program for Historical Linguistics about the Google n-gram viewer – so not exactly the same but related – and we could not make out a way to make meaningful inferences. (Thanks to, for example, duplicated data.)
Might the term “therapist” be more in-vogue these days? It’s easier to spell than psychiatrist and sounds more relatable.
I’d expect to see nontrivial search counts for “Kavanaugh therapist” by those easily triggered.
I’ll see myself out
I’ve done some research with Google Trends in the past and my overall conclusion is that it sometimes works impressively well but the majority of the time it is just noise (I found only 24 out of 71 promising looking search terms validated against survey data on non-sensitive topics). The problem is that you can’t really tell which of them it will be without doing a validation exercise on that specific search term. But if you have access to a source of data for validation it will usually make sense to just use the validation data to answer your question anyway.
(blog with links to the research here)
https://jonmellon.com/2018/01/19/everybody-lies-but-google-trends-is-not-a-panacea/
Re the ‘more/less intellectual’ hypothesis:
A lot of these terms are not primarily used for technical reasons. Most people searching for ‘einstein’ are probably not looking for copies of his work on relativity — more likely are things like ‘how can I be like Einstein’ or ‘baby Einstein’. (And anyone who has spent too much time on the internet should know why ‘mitochondria’ has been increasing.)
My ideas:
1. Use genuinely technical terms (especially ones which won’t be encountered by most high school students). The best examples of this on Scott’s list are probably: ‘arctangent’, which has gone down a lot; ‘zeugma’, which has gone up by a little; and maybe ‘iambic pentameter’, which has gone down by a little. I’d be more interested to see how searches for ‘3-manifold’ or ‘octonions’ go.
2. Compare searches for a correctly spelled word to searches for an incorrectly spelled version. Scott has graciously started this experiment for us with ‘denoument’.
Yes, this is what struck me looking at the “general intellectual interest” terms—unlike colleges, American high schools almost never offer specific philosophy classes, and although there is an AP Psychology, it is always elective. Some amount of math, biology, and English, on the other hand, are almost always required.
The terms chosen to represent general “science” are all scientists, which aren’t likely to help high schoolers googling their homework, but of the remaining terms, I would peg 4/5 math, 3/3 biology, and 3/4 literature (not counting “denoument”) as definitely rating a mention in a high-school course. Also, disregarding “mitochondria”*, the highest-increase terms by a wide margin are “foreshadowing”, “simile”, and “parabola”, the concepts most likely to be touched upon in lower-level classes. Overall I would not expect these terms to select well for either college students googling their homework or the generally intellectually curious.
* “mitochondria” begins rising in 2011 and stabilizes at around 2× previous yearly peak interest in 2015 (but appears to retain its old July valley), while “mitochondrion” does nothing (highest peak 2004). The original “powerhouse of the cell” post appeared April 2013. I actually don’t believe that it drove the increase in “mitochondria” much if at all given a) the timing, b) the fact that the valleys aren’t also boosted (there is no vacation from memes), and most importantly c) the fact that searches for the entire meme are way, way too rare, but I don’t have a better explanation.
@aphyer
I think I’ve spent a lot of time on the internet lately (probably more time in the last three years than in the 47 years before that), but I’m clueless about why searches for “mitochondria” may be going up (a quick websearch shows me that it’s related to cell biology).
??????
It’s presumably a reference to this meme.
Thanks. I couldn’t think of any clues either, except for Wind in the Door, the (not so great) sequel to Wrinkle in Time.
https://knowyourmeme.com/memes/mitochondria-is-the-powerhouse-of-the-cell
One explanation for “left wing politics become more popular in google searches” is that many right-wingers boycott Google because of their left-wing stances and perceived left-wing bias.
That seems unlikely. Only a smart part of the right has any issues with Google, and only for the past year or two. Besides, what are they using instead? Bing?
Yes, or DuckDuckGo.
I read the article last time Scott posted it and it looked like the trend lines could be summed up with “Socialism-related searches spike relative to conservative- and libertarian-related searches around 2009 and 2016, with some lingering popularity since then”. The simple explanation is the market crash, Occupy Wall St, and Obama’s presidency fueling socialism interest around ‘09, and Bernie Sanders fueling interest around ‘16. The author didn’t think this would explain it, but I forget why, just that I wasn’t convinced.
I’d be astonished if any such boycott was large enough to show up in these numbers. If it was, we’d constantly be seeing hand-wringing thinkpieces about it.
Is the U-shape of the “average of nine search terms” due primarily to the U-shape of “students with an intellectual interest in psychiatry”? And whichever population is manifesting the U-shape, what might be causing that?
My personal hypothesis: fragile young people wrapped up in self-absorption.
No matter how emo someone might try to be, humans are social creatures by nature, and while individualism has many benefits, it can be crushing in terms of self-worth.
Whereas before people had a family or community telling them who to be, how to act, and what to do (doctor, good neighbor, die for your country), the modern “you do you”, “believe in yourself” ethos has resulted in the only heroic narrative left being….Babe. If pig wants to be sheep dog, by no means should anyone tell them otherwise!
Young people are particularly impressionable and need guidance. Just because they rebel against authority, they are still leaning on *something* for acceptance. This is increasingly the world of memes and social media, which unlike a family or community relationship is consumer-based. Like what is popular – the pretty, the yummy, the charming, dislike what is not.
So kids these days are easily burstable bubbles. /end rant
Interesting. Maybe you have professional-class kids in mind, though? I adjunct-“teach” working-class and shopkeeper-class kids (including lots of Italians, Arabs, South Asians, Chinese, Eastern Europeans, Nigerians) … only one of them, as far as I know, ever looked at Reddit (that was his thing) and I couldn’t convince him to look at websites (and I think that he was one of the rare professional-class kids who occasionally show up in my classes); otherwise, the only “social media” they use is Instagram and Snapchat — I think they follow celebrities and their friends. Very few have seen any Stars Wars movies; about 10% might have seen one or more Marvel movies. They don’t really have any common references. Except that a lot of them have heard of Rihanna.
I’m talking Instagram and Snapchat.
It doesn’t apply just to the young, but I’m explaining the trends more – more people using google searches are coming from the young. Unclear if it’s showing total results or % of internet users.
Does it divide by all searches to form a baseline?
Another factor to consider is that the way Google works and the way people engage with it has probably changed quite a bit since 2004. In 2004, to get useful results out of Google, you probably still had to think about how to construct a query specific enough to filter its data in the way you wanted, something like
"depression treatment" +Canada -antidepressants -Buddhism. Nowadays, partly due to improvements in how Google interprets queries and partly due to the demographics of people who use Google, you’re a lot more likely to see natural language queries likeim depressed help me no drugs no woo.Also, the autocompletion and “Searches related to” features enable those who wouldn’t otherwise come up with some fairly specific search terms via recall to leverage them via recognition.
Search:
Terrifying results.
I don’t think you can separate the seasonal peaks from psychiatry students searching for “anxiety” as part of their schoolwork from students in general searching for “anxiety” because they have more anxiety at certain points in the school year.
The psych student anxiety should not have specific peaks, but should have specific dips for vacations, while general student anxiety should have peaks around finals.
The effects may not be big enough to meaningfully separate the results, though.
Students don’t cram for exams anymore?
What’s that big peak for “I have depression”? The 2016 election?
Part of the problem with figuring out meaningful results will be figuring out which searches people actually use, not just what you would use for those sorts of things.
My first thought when I saw that depression searches were timed with school was “Oh. School makes people unhappy.”
I’m wondering whether the “sawtooth” effect is repeatable enough that we can quantify and use it as a tool for teasing the academic vs. non-academic interest in a subject out of this data. You’d need a formal measurement of the sawtooth (crudely, April+October-July-December, but I think we can do better), and a dataset of search terms for which the interest can be presumed almost purely academic (see aphyer and switchnode above). But if we can say that the total academic interest is repeatedly X+/-Y times the sawtooth magnitude, that could let us peel away the academic subset and look at the non-academic interest in some of these trends.
Or it could be too noisy to be at all useful, which I fear is most likely, but maybe not?
You could probably do some rough comparative measurement, but there will always be kids with summer homework, textbook authors, teachers making lesson plans, etc.
Right, but we don’t need the sawtooth to go to zero in the “off season” to measure it, we just need calibration search terms where we can be reasonably certain that someone searching on them even in July is doing so for such academic reasons rather than general non-academic interest. From that, we can perhaps establish a broadly useful correction factor for how much off-season academic searching is going on, as a function of the magnitude of the school-year sawtooth.
I believe all the Google Trends data is normalized whether you download one series or multiple series together. It’s just that when you download multiple, they’re normalized on the same scale, which is actually preferable for most purposes I think.
Also you have to be really careful using the data for predictions because the normalization carries some information back from later periods to earlier ones (e.g. a spike in period n+100 will depress the data in period n because the normalization will need to accommodate the spike).
Does someone know–or does Google explain–how they do the normalization? It would be really helpful to make anything other than anecdotal use of the data feasible. My guess is that they pretty closely guard that because of search volume’s connection to the core ad business.
I have the same general reservation about this that I do about scientific studies based on survey data. (WARNING: long rant about study methodology incoming).
Suppose that I am interested in peoples’ height. And I decide to measure their height via ‘barometric pressure on top of their head’. After all, tall people’s heads are higher up than short peoples’ heads, so the pressure there is lower!
And I will discover many surprising things! Nepalese people are far taller than Americans! But don’t worry, we’ve found some simple interventions that will increase your height! Moving out to the country, or at least to an apartment building, will make you much taller!
But this is stupid. To phrase it in a slightly-mathematical way: the overwhelming majority of the variance in our measurements comes not from ‘variance in barometric pressure caused by your height’ but from ‘variance in barometric pressure caused by all the other things that make barometric pressure vary on top of your head’. And so when we find a surprising result like this, it’s much less likely that ‘moving to the country makes you taller’ than it is that ‘moving to the country makes the barometric pressure on top of your head lower for some other reason’.
This is not really fixed by randomized controlled trials either — if the altitude-induced barometric pressure error were random, a sufficiently large sample would, but since it is not random our RCT cannot distinguish ‘the intervention has a systematic effect on height’ from ‘the intervention has a systematic effect on the error term’.
Now, consider a scientific study based on survey data. Suppose you do a survey to find out something about people. How much they like dogs? How many times per month they eat pizza? Whatever it is, you’ll always be getting the same response:
ANSWER = TRUE RESPONSE + SURVEY-INDUCED ERROR
And the survey-induced error is REALLY REALLY BIG! Tiny changes in wording lead to huge differences in responses based on how people think about things/how they interpret the question/whatever.
So when I see an experimental setup like this:
Yes, it’s possible that your documentary has persuaded 61% of the people who watch it to change their minds about an issue. It’s also possible that your documentary has persuaded 61% of the people who watch it to interpret the question differently! If the control group interpreted the question as ‘are you okay with factory farming,’ while the experimental group interpreted the question as ‘did you enjoy watching all these horrible things happen to chickens,’ you could cause a very large difference in responses without actually changing anyone’s mind.
And I think something similar is going on with the Google Trends results.
Suppose we run our Google Trends and see a trend in searches for ‘celebrities’. Maybe this reflects a trend in interest in celebrities. Or maybe it reflects a trend in something else:
People interested in celebrities could be getting more/less of their information via the Internet as opposed to e.g. those magazines I always see by the checkout in the grocery store.
People interested in celebrities on the internet could be getting more/less of their information from search engines as opposed to social media/celebrity news aggregation sites/popup ads full of scantily clad celebrities.
People interested in celebrities on the internet and looking for them via search engines could be getting more/less likely to use Google as their search engine.
People interested in celebrities on the internet and looking for them via search engines and choosing Google as their search engine could be getting more/less picky/internet-savvy/whatever-you-want-to-call-it and searching for specific celebrities instead of ‘celebrities’ in general.
I think it’s overwhelmingly more likely that one of these is the case than that the Google Trends data is actually reflecting a genuine trend in ‘interest in celebrities’.
There’s a very simple answer to the key problem with this approach and it lies in linguistic analysis of usage. The tool you need to use before you look at Google trends is a corpus. The perfect free tool is made available by BYU: https://corpus.byu.edu. A corpus (a collection of representative samples of usage – hundreds of millions of words) will show you how those words are used rather than how you think they should be used. A corpus gives you a representative sample and the tools to disambiguate different forms and context. It will also show you things like collocations (words used frequently together) and let you filter by genre, year, etc. You can also search a historical corpus to give you better control over trends than Google n-grams. Anyway, you should always use a corpus when words are involved.
To show what can be done, I did a little study on the word ‘literally’ to show that its ‘actual’ meaning is quite different from what people who keep correcting other people imagine. http://metaphorhacker.net/2011/02/literally-triumph-of-pet-peeve-over-matter/
There’s a fundamental linguistic fallacy involved in the psychiatry/psychiatrist paradox, namely the assumption that just because 2 words are semantically related, they would be used in the same way in similar context. The worst thing you can do when you want to find out about what words ‘actually’ mean (ie. the context of their likely usage from which you can infer their user’s intention) is to look them up in a dictionary or a thesaurus. It is marginally better than relying on your intuitions. But unless you know what you’re doing, you’re going to do more harm than good to your inquiry.
What comparing psychiatry and psychiatrist in a corpus will show you is that they are not used in the same way. Psychiatrist is used in the context of describing a person’s job and/or somebody’s need for their help. Psychiatry, on the other hand, is used almost always in the context of describing an institution (Department of Psychiatry) or in a list of disciplines. Never, ‘I’m feeling depressed, maybe psychiatry would help here.’ But often ‘I was depressed and went to see a psychiatrist’. I only spent a few minutes on this, so I’m sure more interesting data could be had but it seems clear that there is no paradox. So based purely on that combined with your Google trend, you could conclude: fewer people want to study psychiatry and more people need a psychiatrist, or vice versa (depending on where you are on the graph). But this is still very tentative. What you would really need is a corpus of the queries themselves, ideally accompanied by the subsequent clicks.
The corpus evidence in iWeb (14billion words), is that both words have about the same frequency. But if you search from all psych words (psych*), you will find that they are about half as frequent as ‘psychiatric’ (not surprising since usage combines institutions and issues) and an order of magnitude less frequent than ‘psychology’. You can also use the COHA (historical) corpus to show you some trends in usage – peaks in the 1960s and 70s followed by a decline in both words. This is confirmed by the TIME Magazine corpus which shows you zeigeist trends by decade. None of this is as up-to-the-minute as Google trends but removes some of the noise.
In short, if you’re interested in word usage, use a corpus before you do any other analysis. Pro-tip: Before you use it, read a description of the corpus source data and a manual for how to make the most of it.
This is far from the most interesting thing in the post, but did you buy a personal license for SPSS, or are you getting it through work?
Oh man, I hadn’t even thought about pirating SPSS.
The actual context for this question is that I briefly worked at a place that had SPSS, and it struck me as a pretty terrible tool for what I was trying to do, so I was trying to figure out if Scott liked it and had sought it out, or if it was just something lying around on the work server.
Scott has been using SPSS for a long time. I think that it is his tool of choice, in that it’s the only one he knows and he doesn’t want to learn another.
SPSS is good for infrequent users since it allows you do click and select all the stuff you want to do without offloading anything to your long-term memory. No need to memorize the name of functions and what arguments they take.
For data wrangling, there’s Excel.
There are a number of competitors with similar features, like graphpad’s Prism and SAS JMP but if your needs are ‘run a few regressions once per quarter’ SPSS works great and the cost of switching to a competitor is prohibitive.
Some general tips are below:
1. You can use minuses to eliminate problematic searches. E.g. ‘suicide -squad’
2. You can use categories to narrow the topic area. For example, the category ‘health’ limits the types of searches included in the series.
3. The trends algorithm has changed a bit over time with a trend break in 2009. Also, since the series is always relative to total search activity (which is changing over time) it is hard to interpret long-run trends.
You may be interested in some of the academic work about how to use Google Trends.
A hands-on guide to Google Data
http://www.sims.berkeley.edu/~hal/Papers/2015/primer.pdf
The cost of racial animus on a black candidate: Evidence using Google
search data
https://people.cs.umass.edu/~brenocon/smacss2015/papers/StephensDawidowitz2014.pdf
The Impact of Unemployment Insurance on Job Search: Evidence from Google Search Data
https://www.mitpressjournals.org/doi/abs/10.1162/REST_a_00674
Averaging large number of key words would be a lot simpler if the results were not normalized. The results are normalized by their maximum before you do the averaging, which makes the resulting average very challenging to interpret.
aphyer touched on this a bit in passing — if you have an ongoing interest or chronic problem, you very possibly have bookmarks and shortcuts to various expert sites or aggregators, largely negating the need to do much fresh googling on it.
So search trends might tell you more about sudden spikes or bandwagon effects rather than deeper ongoing interest in a term. Or maybe this effect is just too negligible?
By the way, I’ve long heard that September is considered the second most stressful time of year, along with the “holiday season.” Lots of changes in routine as well as pressure to rev things back up, launch new initiatives etc. as everyone’s back from summer. True of people in general, not just academic-related. For many people September really is the new year, more so than January.