
[Epistemic status: As always, I am not a statistician, and anything I say should be taken with a grain of salt until confirmed by others]
I.
A while ago, I wrote Beware Summary Statistics, where I talked about all the ways I’ve been misled by things like r-values and so on. I recently found some really interesting cases that brought up a few more some of these issues.
Back in June, Noah Smith blogged about a study on IQ And The Wealth Of States.
Some background: a group including Richard Lynn suggests that IQ is the driving factor behind income differences among countries. They are able to cite statistics on how a very rich country like Singapore has an average IQ of almost 110, and a very poor country like Haiti – well, it’s hard to say, because not too many Haitians take IQ tests and the ones who do might be so confused by this weird new idea of filling out a written multiple choice test that they choke and underperform – but officially Haiti has an IQ of like 70. Since you need smart people to build cool things like highways and power plants, maybe this explains a lot of the development/underdevelopment dichotomy. These people can point to a pretty good correlation between national IQ and national development to support their thesis, but the obvious counterargument is that maybe highly developed nations have good health and good education which raises IQ.
Anyway, the study Noah blogged about tested the application of this theory to US states. Noah sums up the results as follows:
The upper bound for the amount of state income differences that can be explained by population I.Q. differences is about a third. If we assume that achievement scores are a good measure of I.Q. and that school attainment doesn’t improve I.Q. very much, then the number goes down to about one-sixth.
What this really shows is that there is Something Else that is driving state income differences. My personal guess is that this Something Else is mainly “external multipliers” from trade (the Krugman/Fujita theory). Institutions probably play a substantial role as well (the Acemoglu/Robinson theory). That’s certainly relevant for the debate about different models of capitalism, where we often compare the U.S. to Scandinavia and other rich places.
In any case, this result should be sobering for proponents of I.Q. as the Grand Unified Theory of economic development. Average I.Q. is not unimportant for rich countries, and we should definitely try to raise it through better nutrition, education, and (eventually) brain-boosting technologies. And it still might matter a lot for some poor countries. But for rich countries, there are things that matter a lot more.
II.
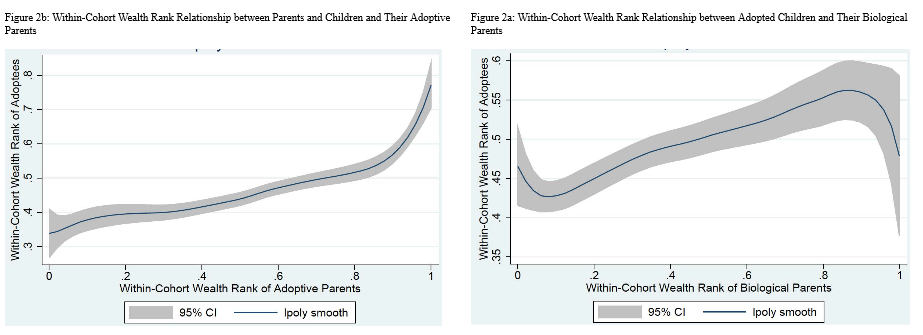
Let’s go to another study. The Atlantic has an article on How Rich People Raise Rich Kids, which is about Black, Devereux, Lundborg, and Majlesi (2015). They look at adopted Swedish kids and determine whether their wealth (not income!) as adults is more correlated with that of their biological parents or their adoptive parents. They find that non-adopted kids’ wealth correlates with that of their non-adopted parents at 0.33, adopted kids with biological parents at 0.13, and adopted kids with adoptive parents at 0.23. This suggests that upbringing is more important than genetics in determining how much wealth you will have.
Part of me wonders if an adoption study is really the best way to deal with this. Giving your children up for adoption is a very unusual choice, which means the biological parents are a very nonrepresentative group – and the study indeed finds that even forty years later, these biological parents have only a third as much money as the average Swede. If the same factors that cause them to give their children up for adoption – illness, relationship problems, trouble with the law – also cause them to fail to live up to their “genetic potential”, then we wouldn’t expect their children (who may lack these issues) to be correlated with them. The extremely odd shape of the graph also gives me pause: after a certain point, the wealthier your biological parents were, the less likely you are to be wealthy. Why? Certainly there’s no such effect for adoptive parents or non-adopted people!
But nitpicks aside, I am pretty willing to believe this. Although other studies have found evidence that biology is more important than upbringing in determining income (not wealth!), wealth seems like a different story. For one thing, you can just give your kids money! As I said last time we talked about GiveDirectly, there is pretty good evidence that giving people money causes them to in fact have the money which you just gave them. The current study reasonably tries to avoid having to deal with inheritances by looking at people whose parents are still alive, but even living parents can give lots of money to their children (for example, I come from a pretty wealthy family and my parents gave me lots of money, which I mostly used to help get through medical school without much debt. This means right now I have more “wealth” than people who took out bigger loans).
The authors write that:
While we have established the relative role of nature versus nurture, the exact mechanisms of wealth transmission are more deifficult to ascertain. Wealthier parents tend to be better educated and earn higher incomes, and these factors could lead to the increased wealth of their children through, for example, teaching them about investment opportunities or providing the right opportunities. However, when we investigate this, we find little evidence that this is the case. It may also be that wealthy parents invest more in their child’s education and career, which could then lead to higher child wealth accumulation. When we examine whether this is the case, however, we find little evidence for education or income as mechanisms. So the pathway through which parental wealth affects child wealth does not appear to be primarily parental schooling and income or child human capital accumulation and greater labor earnings. Taken together, our findings suggest potential roles for intergenerational transmission of preferences (children of wealthier parents may choose to save more or invest in assets that have higher returns) or for financial gifts from parents to children. Unfortunately, we do not have information on savings behavior or on financial gifts so this evidence is only suggestive.
So it seems to be a matter of how much money your parents give you, rather than of you learning deeply important personality traits from them or something. Fair enough.
But I got distracted. I was talking about the Atlantic’s article about the study. What did they have to say?
Even when they’re adopted, the children of the wealthy grow up to be just as well-off as their parents.
Lately, it seems that every new study about social mobility further corrodes the story Americans tell themselves about meritocracy; each one provides more evidence that comfortable lives are reserved for the winners of what sociologists call the birth lottery…What appears to matter—a lot—is environment, and that’s something that can be controlled.
III.
Let’s talk about three things – correlation, percent variance explained, and reality.
(I’m talking a big talk here, but I only got a good feeling for this when I asked various people on Tumblr to explain it to me. But they did a good job, and now I’m explaining it to you.)
Correlation is an r value. Percent variance explained is correlation squared. Reality is best viewed in the form of a graph.
Noah tells us that the IQ-of-states study found that only about 14% of the variation in state GDP was explained by IQ. Since variance = correlation^2, this implies that there’s a correlation of sqrt(0.14) = 0.37 between state IQ and state GDP. The paper itself did some sort of super high-powered nuclear statistics to arrive at this estimate, but I took lists of state average aptitude test scores and state GDP per capita and correlated them together in SPSS and got 0.40, so easy way and hard way agree pretty closely.
Here’s the graph associated with the study (I added the line):
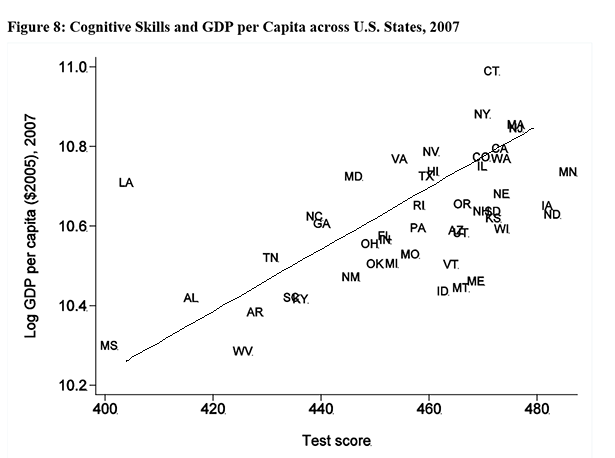
(Proposed new state motto: “Louisiana – Where We Succeed Wildly Out Of Proportion To Our Low Intelligence!”)
Huh! When you hear “…only explained 14% of the variance” it sounds like “go home, this is boring,” but when you hear “correlation of 0.37”, it sounds like “huh, they seem pretty related”, and when you see the graph, it looks like “holy frick, everything is IQ after all”. But all of these are the same finding!
Now. Consider the Swedish study and the Atlantic article about it. They say that although biological parents were correlated at r = 0.13, adoptive parents were correlated at r = 0.23. Therefore, they conclude, nurture wins over biology, meritocracy is a myth, everything depends on the lottery of birth, and wealthy parents are foredoomed to have wealthy children.
But r = 0.23 means the percent of variance explained is 0.23^2 = ~5%. If some Social Darwinist organization were to announce that they had evidence that who your parents were only determined 5% of the variance in wealth, it would sound like such overblown strong evidence for pure meritocracy that everyone would assume they were making it up.
The study didn’t come with a scatter plot, but here’s a plot from a totally different study that got a very similar correlation (0.24) to give you a feel for what it might look like:
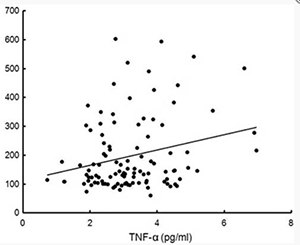
The article makes it sound like your position in the birth lottery determines your destiny with impressive finality. The correlation seems unimpressive. The variance seems really unimpressive. The scatter plot looks like someone took random noise and drew a line through it. Once again, all the same finding.
Which of these three ways of presenting the data is most accurate? Um. Hard to say. I asked some people whether correlation (ie r = 0.23) or variance (ie 5%) is a better description of how the world actually works. That is, given that I have a certain “feel” for how much people differ in wealth, and a certain “feel” for what it means to win the birth lottery by getting rich parents, should I feel like the birth lottery thing explains 23% of how much wealth you have, or only 5%?
(I was only a Discordian for like six months, in my freshman year of college, but I still end up with fives and twenty-threes every time I try to do something involving numbers)
The answers I got were that it’s complicated, and both sort of work even though intuitively they should be mutually contradictory. The distribution of wealth is consistent with a story where it is explained by twenty different factors, each of which is just as important as parental wealth, which is sort of like 5%. But parental wealth explains just over a fifth of the standard deviation in wealth, which is sort of like 23%. The best explanation I got, from an anonymous commenter, was this:
About variance: consider the following. Flip 25 coins. Each heads gives you +1 utility point, and each tails gives you -1 utility point. One of these coins is labeled “upbringing”. On average you get 0 utility points. But you can also expect not to get exactly 0: on average, your distance from 0 will be 5 (the stdev is 5). So this is a little similar to a single coinflip that gives you either +5 or -5. Changing your upbringing from -1 to 1 gives you 2 points, out of a typical range of -5 to 5.
There was also a general consensus that if I had to think about this intuitively, which I should try not to do, 5% was probably the number that would lead me less astray, at least in terms of inputs. So fine. Whatever. Five percent it is.
IV.
Stalin once said that “The people who cast the votes decide nothing. The people who count the votes decide everything.”
(I briefly questioned whether Stalin really said that – like, I know he was an evil despot, but I’m not sure he was sufficiently self-aware about being an evil despot to come up with witty evil-despotism-related quotes. But I checked his WikiQuote page, and not only is the saying well-attested, but it seems Stalin was totally all about coming up with the witty self-aware evil-despotism-related quotes. Huh.)
In the same way, the people who conduct a study decide nothing. The people who report on the study decide everything.
I think Noah and the Atlantic were both honest and did a decent job reporting on their individual studies. But taken together, Noah concluded “This shows that IQ doesn’t really matter that much in explaining GDP” and the Atlantic concluded “This shows that who your parents are matters a colossally huge amount in explaining wealth” when in fact if you put both the studies side-by-side the IQ finding is three times as strong as the parents finding.
[EDIT: Some people have been misunderstanding this, so let me say it clearly. These are two studies about two different things! It’s like if I said the percent of weight gain explained by carbohydrates is three times as large as the percent of crime explained by poverty. I can compare these two things statistically, but I’m not trying to combine them into a single meta-study where I say that carbohydrates cause more crime than poverty! Also, some people seem to think I’m saying the Swedish study finds genes/biology/IQ to be more important than nurture. It doesn’t – in fact, it finds the opposite! Nurture is more important than genes but in the grand scheme of things both are tiny and the variance is almost entirely due to other things or randomness.]
In the end, nobody except a handful of researchers is going to remember the exact number. But they might remember “There were a couple interesting studies recently, one of them proved state IQ didn’t matter, the other proved that who your parents are totally determines whether you get ahead in life.” Framed that way, you might actually have gained negative knowledge from your diligent attempt to understand the economic literature.
And if the surrounding culture is pretty united in wanting to push a specific line, by choosing whether to publish r values or percent variance explained or graphs, they can pretty much hijack the intuitions even of people who don’t accept their reporting and try to rely on the numbers themselves.
The antidote is to have a good grasp of what each statistic means. And another antidote is to dial down your expectations. Remember, the study above was only able to correlate state IQ and state GDP at r = 0.4, but almost nothing in social science ever gets above 0.4. Trying to correlate rich parents with kids who become rich only got 0.2! 0.4 is pretty impressive and if you’re holding out for too much more you’re going to be living in a constant state of disappointment. I can think of one exception off the top of my head, and I am proud to say you will only find it here.


It is worse. Even in students textbooks, often size of the effect is no mentioned, so in the end psychology students minds get creeped in with knowledge about some relations that are in minor, but since it is not mentioned, i bet they think the relation is important.
I remember that two decades ago there was quite infamous book, called The Brain Sex or something like that, about Gender/Sex differences. I read it as a very young kid, so missed all the reviews and opinions, and decided, it was cool book.
I mean, it listed a ton of differences, and also mentioned that the only one that is very significant is skin sensitivity (precisely, ability to distinguish between two stimuli on the back, women could do this with the stimuli much closer to each other*). How i was surprised much later on when i read that this book was all about nature, huge and immutable differences and all that stuff that is present in the debate (war, really) about humans. How people got that from that book, well, the post is probably partly about that.
*Its bizarre. I mean, evopsych/sociobiology is funny its the way that it is possible to come with ad-hoc hypothesis for pretty much everything (and often for two contradictory ones, or even opposite), yet i have no idea why such thing would happen. Any takers? 😉
Random hypothesis: women need to be more careful with their bodies because they sometimes have fragile babies inside of them.
But, but, back? Why back of all places, and not, to go along your hypothesis, abdomen, much closer to pregnancy area?
The only thing i can think of is some wierd side effect of something, but it is still bizarre, and a cop-out, to be honest. The other hypothesis (also a cop out) is some sort of laboratory/reporting/documentation fuckup like the iron in spinach one. A bit likely, because it really stands out (basically, in every other thing, the gendered curves of distribution of traits are mostly over each other, but in this example, they dont even come close to each other)
This is completely unrelated to everything:
Well actually your Stalin quote made me think of world readers and quotes.
“the people who conduct a study decide nothing. The people who report on the study decide everything.”
-Alexander the Slate
Okay. Coming to this late again. I think there are all sorts of cultural attitudes also that contribute to wealth in life that are not really discussed by the Atlantic article. Here is how I see it.
1. In large swaths of Anglo-American culture, there seems to be a thing where the kid is out once he or she reaches the age of majority. I’ve known people whose parents have done something along the line of “Happy 18th Birthday!!! Now give me the keys to my house! Goodbye!” This doesn’t necessarily happen in working class families only but I have seen it in more working class families than not.
2. The value for kicking kids out of the house at 18 seems to be independence above all in a sink or swim kind of way. The kids who grow up with such a technique might always be able to find work but it will be more of the job to pay the bills kind of way as opposed to long-term career and income growth kind of stuff. This is a philosophical preference for children though.
3. My general observation is that people think along these lines: “I love/hated how I was raised. I will do exactly/the complete opposite of what my parents did.” This is a bit of hyperbole but generally true. I know someone who was really pushed hard by her parents. Hard enough that she graduated from a very prestigious university in three years instead of the typical American four. Now that she is a parent, she posts lots of stuff on social media about the importance of unstructured play.
4. Related to #1 and #2 is whether your parents raised you with the idea of job or career. I know people who were the first in their family to go to university and all their parents did was pester them about “How is this going to get you a job?” Notice the word. Job as in something that gives you a paycheck on a regular basis. Not something like a career which can take a long time to get via study and apprenticeship, might require to take one step back to eventually take two or three forward, etc. My parents were professionals and wanted me to have a career and they gave me encouragement during some rough patches to move forward instead of taking an easy way out to look for a secure position with job security.
Of course some rich parents can help their kids more than others. Some parents say things like “I think real estate is a good investment so I am going to give you a loan so you can invest in property”, etc.
By Anglo, I mean people whose ancestors came from Britain generally. I have never seen the “You are 18!! Goodbye!!!” thing done in Asian cultures, Italian or Greek families, Jewish families, African-American families, Latino(a) families, etc. There seems to be something very British about the idea of kicking kids out at 18 just because they became adults.
One friend said that her parents asked for the keys back when they dropped her off at college. I find this very strange. I still considered myself a resident of my parent’s house when I was in college even if I lived in the dorms. I graduated college at the typical American age. My acquaintance graduated well into adulthood because she did everything by piecemeal with gaps to work and stuff like that. And I have seen people seriously argue that the way to make college/university more affordable is to put more people on a 10 or 12 year plan and I find that bonkers.
Even at 34, I have keys to my parent’s house and brother’s apartment. This is because we are a family that looks after each other but there seem to be families where this is considered a kind of dependency/weakness.
I think you are right, and while there are a lot of disadvantages (social, emotional, financial) to this kind of attitude, it seems to be very good for the economy to force as many people as possible to become autonomous economic production-consumption units.
At the opposite end of the extreme, I’ve read a partial theory for much of Africa’s perennial economic underperformance: many African societies have such a strong family/clan mindset that as soon as anyone comes into a bit of wealth, he is expected to spread it around his entire extended family/community network. This may inhibit capital accumulation.
Greek culture is similar. Ironically, this is one of the things that has helped Greeks weather the current economic crisis; most people have family to turn to.
I wonder if (within the Christian world) there is a Protestant/Catholic (and Orthodox) divide — related to the “Protestant work ethic,” perhaps? Saul mentioned families with British backgrounds, but I see the same dynamic with families from German backgrounds too.
I am not sure that this hurts Africans and Africa. There are lots of things that hurt Africa like centuries of being taken as slaves by force and colonialization. Wealthy African nations like Kenya still have the strong family/clan structures. So do a lot of Asian nations where it is not uncommon for people to live in multi-generation households for their entire lives and no one considers you odd for living with your parents for a long time.
My parents will always give me a place to stay but I don’t think we want to live with each other either.
I think you need some family/clan support to establish capital though as well unless you are really lucky. My friends who were made completely autonomous at 18 do not seem likely to build up capital. They took longer to graduate from college (if they did at all), they did so with more debt than even someone who just did it in 4-5 years, my acquaintance can always get a job in food service but she seems to spend so much time in that mode that it took her a long time to find a position with career and income growth.
There was an article in the Atlantic about how young people who start companies tend to come from well-to-do families and have personal safety nets. In my experience, this is true. The young people I knew who were able to take career risks and start companies generally come from well-to-do families, their families were able to support them in some ways, and/or introduce them to potential investors, and/or get them into schools/situations where it is easier to meet early investors. You are much more likely to attract capital if you went to Harvard Business School over UT-Austin and UT-Austin has a pretty good Business School.
This might or might not be a problem but I am generally inclined to think it is a problem and a cause of wealth and income opportunity.
as soon as anyone comes into a bit of wealth, he is expected to spread it around his entire extended family/community network. This may inhibit capital accumulation.
While most non-European cultures are far more clannish than NW Europeans, the dynamic among, for example, the Chinese appears to be not quite the same. A Chinese person succeeding in business may be expected to hire his relatives before strangers, but those relatives are expected to pull their weight – one has to be more successful before there’s an obligation to support non-immediate-family members who are incapable of or unwilling to work.
Troy mentions Greece making it through their crisis because of this effect. The expectation that you’ll help out your less-fortunate relatives is reciprocal, and in a society where poverty is widespread and it doesn’t take much to become desperately poor, that expectation is a very useful survival value. Unfortunately, it’s a value which inhibits advancement out of poverty, both individually and societally.
Also look at Jewish-Americans and Asian-Americans, who still tend to have an attitude for their children of “You are going to college and/or going to grad school”. A lot of people found it shocking that my parents had an expectation that I needed to get a graduate degree of some kind.
The whole college is not for everyone argument seems to mainly come from people with Protestant backgrounds as well and usually deeply evangelist ones. Most Jewish-Americans and Asian-Americans seem to prefer their kids become lawyers, doctors, engineers, businesspeople, academics, etc over pride in a story of starting a small business at 18 and building from there without a college degree.
So part of capital accumulation or financial-income success might also revolve around respecting education as a social good and thinking it needs to be done seriously and as quickly as possible. The people I know who like the ten-year plan seem to do so because it is independent, seems to mean paying your own way largely, and doesn’t require government intervention. I think it is better to have people graduate earlier and then have more time to earn money at higher salaries.
Yes, it doesn’t seem to hurt the Chinese, and it is still common for Chinese to have three generations in one house, and for people to borrow money from relatives to buy a car or house sooner than borrow it from a bank. But they also have a very pro-enterprise, pro-education mindset. The pro-education mindset is very old; in pre-modern times the Chinese, like seemingly everyone else, are very anti-merchant in ideology, but they develop a merchant economy anyway pretty early on, so there’s a tradition of that too.
Also, no offense to you personally, but I wish people in general would stop pointing out slavery and imperialism all the time. There is no one who doesn’t already know that slavery and imperialism might be a factor in the underperformance of Africans and African Americans. It gets a little tiresome to always hear, “well, there was a little thing called slavery…” every time one mentions other factors.
It’s called the “absolute nuclear family” and it’s mostly seen in old Anglo-Saxon regions. David Willetts wrote about it in 2010:
“Instead, think of England as being like this for at least 750 years. We live in small families. We buy and sell houses. … Our parents expect us to leave home for paid work …You try to save up some money from your wages so that you can afford to get married. … You can choose your spouse … It takes a long time to build up some savings from your work and find the right person with whom to settle down, so marriage comes quite lately, possibly in your late twenties.”
http://www.vdare.com/articles/david-willetts-the-pinch-uk-cabinet-ministers-discreet-but-devastating-dissent-on-immigrati
R vs. R-squared, my favorite topic … I’ve written a bunch of posts on this topic the past few years. Chris Povirk actually pointed to one of them. Here’s a link to the one that (I think) has been the most popular, with others linked at its end.
Generally:
The correlation coefficient (r) tells you how much of X (in standard deviations) you should expect to see in Y. So, r=0.23 means that for +1 SD of X, expect +0.23 SD of Y. This is usually the one that is most relevant.
The r-squared, on the other hand, tells you what percentage of Y is “explained” by X, in contrast to *every other independent explanation*. So, if r=0.23, that means r-squared = 0.05, approximately, which means that birth order is “one of twenty” real-life explanations of the variation in wealth. This is not usually the one that’s most relevant.
Of course, you can use the one that makes your case stronger. “23 percent of variation in wealth is passed on to the next generation” makes is sound big. “Wealth only explains 5 percent of the variation” makes it sound small. But they’re both correct.
One way to keep it straight is to realize that r-squared is actually a percentage of the total of “square dollars.” It doesn’t mean anything in real life units. So you can’t use it to say anything about wealth — only about EXPLANATIONS.
r=0.23 means “23 percent of a standard deviation of wealth.” r-squared=0.05 means “5 percent of the total explanation.”
I realize it isn’t the point, but I don’t understand this:
Wouldn’t that be better evidence for wealth being almost entirely a matter of pure luck?
“IQ and Statistics” now means “Smoke and Mirrors” . Absolute majority of social studies are poorly constructed agenda driven farce, especially for politically sensitive topics such as IQ, Income, Crime, Race, Gender .
What is to be gained by analyzing them? Do you want to know truth? -but you cannot know it from those studies as they are not designed for it. Do you want political/debate argument ammunition? Don’t we have plenty of those already
Studies such as this state has higher average IQ but has lower overall GDP serve to what purpose? Its not like there is any consideration of doing anything about average IQ anyways, so what the point of that study exactly except further its narrative agenda?
Countering the agenda which says wealth disparity is the result of Evil Conspiracies and not only should we forcibly diminish it, if we do, it will stay dissipated.
As an adoptive parent I very much doubt any study can adjust for certain factors. Adoption requires a mountain of paperwork, vetting by professionals and federal, state and local (and sometimes foreign) officials. Nobody adopts by accident. The determination and consciousness of the adoption process are tough to compare with biology. Even though adoption often involves children who have been abused or have severe medical issues outcomes are often positive. But I don’t think we can generalize findings about wealth or nations from adoptive parents.
As far as IQ/nations there is definitely something to that. I’m not going to start my spacecraft start up in Haiti. And the US state picture looks much like I’d expect it to. Rich people in Mississippi can only hire so many smart tutors. But there is mobility between states especially for the rich. Where are the Romney and Bush and Clinton families from?
I have found this analogy on “equation coefficients” vs. r-squared helpful.
The more important fact is that “variance explained” is NOT a measure of causal importance. Not at all.
I think this example came from somewhere else originally, so I’m not claiming originality, but it should help understand why.
Imagine a bunch of military guys. All of them have two legs, except for the ones who have been in an accident (car bombs, land mines, etc.) and had either one or both legs blown off.
If you do the standard statistical analysis, you’ll find that genetics explains zero of the variance in “number of legs,” and that “accidents” explain 100% of the variance.
So, like any good researcher, you confidently announce to the world, “Genes make zero contribution to legs. No connection at all.” Which would be 100% wrong. *Variance* in number of legs may be caused mostly by land mines, but the fact that there are two legs in the first place has everything to do with genetics.
I agree that a person who had no DNA in their body would not be making an income. But in this case, I think variance in wealth (or GDP, or whatever) is indeed what we’re interested in.
“Nurture is more important than genes but in the grand scheme of things both are tiny and the variance is almost entirely due to other things or randomness.”
Ecclesiastes had this figured out 3000 years ago:
I returned, and saw under the sun, that the race is not to the swift, nor the battle to the strong, neither yet bread to the wise, nor yet riches to men of understanding, nor yet favour to men of skill; but time and chance happeneth to them all.
In terms of gaining intuition, I’d recommend discretizing the data. A way of going about comparisons afterwards is along the line of statements like “in the lowest quintile for IQ the median GDP of US states is X, vs Y for the highest quintile”. To compare two different studies, one could use stuff like (Y-X)/Y. In this example, looking at the medians for the three intermediate quintiles could help convince us that the correlation is there.
Great idea to plot the full graph too. Reminds me of looking some years ago at a blog post that showed the full graph for the violin study that the 10,000 hours meme is based on (sorry for the lack of link : S, looked for a while). And one can of course see that while there is a correlation, it’s far from being a deterministic thing.
Looking more at the “misuse of statistics” side of the post, I mostly just wish that not that many bad decisions are actually taken based on the kind of analysis it identifies (my experiences in situations where powerful people/institutions are involved is that either people don’t care statistics at all, or they know what they’re doing, but I suspect there must be swathes of the world where there is power and that don’t work like that..)
Thank you very much for this post.
I have a suggestion for clarifying one sentence in it. You said, “…If some Social Darwinist organization were to announce that they had evidence that who your parents were only determined 5% of the variance in wealth, it would sound like such overblown strong evidence for their position that everyone would assume they were making it up.”
Shouldn’t that be, “…the environment in which you are raised”, rather than “parents”? It was really confusing for me as written, because I think ‘biological parents’ when I read ‘parents’.
To me the most intuitive way to think about the way different factors “contribute to” some trait is in terms of controlled experiments (or thought-experiments). For example, to really get a sense of the way parental wealth vs. genetics contribute to the wealth of the child, I would imagine one experiment where a bunch of clones are placed in different adoptive families which differ in wealth (but are alike on as many non-economic traits as possible, like education and political views), and then imagine another experiment where a bunch of genetically different kids are placed in families with identical wealth (also alike in as many non-economic traits as possible), and see what the spread in wealth of the children would be in each case.
What I’d really like to see is for someone trained in statistics to put together various mathematical models of different numbers of independent traits (and perhaps also some models involving correlated traits) which are all designed to replicate the observed statistics in a given study, and then see what the models themselves would predict about controlled experiments like the ones I describe. I think this would give me a better intuition of what variance and correlation might tell me conceptually, and also how the answer might be affected by differences in the models such as the number of independent factors assumed.
I can compare these two things statistically, but I’m not trying to combine them into a single meta-study where I say that carbohydrates cause more crime than poverty!
WELL, WHY AREN’T YOU? DON’T YOU WANT TO GET A PAPER PUBLISHED??? 🙂
The news media would eat that up with a spoon. Consider:
(1) Carbs make you fat
(2) Poor people are obese
(3) So poor people are consuming too many carbs and not enough healthy (excuse me, I believe the current American term for that is “healthful”) fruits and veggies
(4) Poor people are criminals
(5) Ergo, carbs = fat, fat = poor, poor = criminal, thence carbs = criminal
(6) Solution: put everyone on a weight-loss regime of carrots and ten mile runs every day, and crime will decrease!
There you go, and I won’t even ask for a mention in the footnotes. (And I bet ten minutes’ Googling would give me studies to back up at least the first four points).
But if carbs only cause crime through causing poverty (step 4), how could they cause more crime than poverty? HUH? HUH?
Besides, I’m already on record saying that the dietary substance which causes crime is omega 6 fats
Scott, Scott, Scott – I’m not saying carbs cause poverty, I’m saying poverty causes carbs!
Poor people are fat. Poor people are criminals. Poor people get fat because they eat too many carbs.
What is the difference between thin rich people and fat poor people? Fatness!
And before you jump in to say “Also, money”, I’ve got that covered.
Rich people can afford to eat all the carbs they want, yet they don’t eat as many carbs as poor people. Rich people are not criminals. So it is obvious that carbohydrates and not money (or the lack thereof) must be the causal factor behind criminality.
You see, my hypothesis is unassailable!
I thought “healthful” was the more correct term, because, technically, most things we eat are already dead, and therefore, not “healthy.” Rather, they are health-promoting, i. e. “healthful.”
But most Americans call that “healthy” too.
“Healthful” seems to be the term used by medical or quasi-medical types; it sounds to my ear like an over-formal correction – “healthy” is too much a layman’s term, to sound like a Proper Nutrition Specialist you have to use the jargon, so “healthful” it is.
It’s no better a term than “healthy”; if a dead plant is not healthy, neither is it full of the mysterious element or quality “health”. What they really mean is “health-inducing” or “contributing towards health”, so they may as well stick with “healthy”.
But then, every profession needs to re-invent the wheel periodically, especially in a field where coming up with the Latest Diet To Make You Live Forever or Magic Supplement or Really Scientific Research is a vital part of the job; anyone can talk about healthy (your granny can tell you what’s healthy to eat) but only a Real Proper Trained Educated Specialist is the only one who can tell you what’s “healthful” 🙂
I believe I was taught the “healthy” vs. “healthful” distinction in high school, thirty years ago, so it’s not a recent grammatical innovation.
Scott, I added an update to my post to make sure everyone understands:
http://noahpinionblog.blogspot.com/2015/06/iq-and-wealth-of-states.html
I actually had no objection at all to the way you reported on that study, and found it interesting, but I needed a foil to the Atlantic saying that r = .23 was a huge effect, and your post fit the bill perfectly. Please don’t take this as criticism.
Oh, no worries. I think the key points in all this are:
1. The modal quality of stats reporting in the media is horrible. This will hopefully improve over time, because data journalism is so new.
2. The results of structural models are really hard to explain, since everyone is so used to OLS.
3. Counterfactuals are the best way to explain structural model results, but these can seem like “magic”, because the result just seems to come out of nowhere – all the interesting stuff is in the guts of the model.
Whether the effects are tiny or not depends on the causal model assumed.
With some more or less reasonable assumptions, the correlation of 0.13 for wealth between biological “mid-parents” and their adopted-away children means that the heritability, or genetic variance, of wealth is 13 percent. You don’t square it because the correlation between biological parents’ wealth (BPW) and adopted-away child’s wealth (ACW) is not due to the former causing the latter but due to both sharing some of their causes (A). The causal model would be like this:
a a
BPW ← A → ACW
A is the “additive genome” which is the same for the mid-parent and the child. Because we know that corr(BPW, ACW)=0.13, we can deduce that the regression weight a=sqrt(0.13)=0.36. The square of this regression weight is the additive heritability of wealth, 0.36^2=0.13. We can also predict that a one standard deviation change in the genetic value A will cause a 0.36 SD change in wealth.
I’m not quite sure how to interpret the correlations between parents’ wealth and that of the children they raised (whether biological or adopted). Some of it should probably be interpreted as above (parents environmentally or genetically transmit wealth accumulation skills), but some it should probably be regarded as a direct effect (and therefore squared). At the maximum, familial effects could explain about a third of wealth differences, so it’s not necessarily a tiny effect.
The fact that there’s much less variation in wealth among those who gave away their children and among the adopted children versus among non-adoptive parents and children, as discussed above, suggests that corr(BPW, ACW) may underestimate heritability in the population at large.
Regarding Stalin’s self-awareness: Just watch him in this video.
https://www.youtube.com/watch?v=fik2-kgOgng
‘It’s not the voting that’s democracy, it’s the counting.’ Tom Stoppard, Jumpers.
It’s studies like those you mention that will get a hyperlink in advocacy articles. Someone will be writing about income inequality or something and link to two to three studies. The writer will briefly mention in one or two sentences, that, e.g., studies show (or he will use the word, “suggest”) that rich parents determine their children’s success, and then move on to possible solutions to the perceived problem. The studies themselves will not be further scrutinized, if they ever were in the first place, but rather accepted as the truth.
I am also not a statistician, so I am wondering if there is any significance to the fact that IQ is being plotted against the logarithm of GDP per capita. If the dependence of GDP per capita on IQ is exponential while the dependence of adopted childrens’ wealth on adoptive parents’ wealth is linear, doesn’t that suggest that the former dependence is stronger even if the quality of fit is the same? The functions we are fitting are not the same.
This depends on what you mean by “stronger.” One way to think about statistical relationships is “I have some uncertainty about what Y is. If I knew X, how much would that reduce my uncertainty?”, which implies that the deepest meaningful units are something like “probability,” but that’s very complicated to discuss. So we typically talk in units of Y divided by units of X (one meter per second, say).
But from the statistical point of view, it doesn’t matter what the units of Y and X are, and depending on what we want to talk about, natural units shift. Whether Y is dollars or log-dollars (whose integer part is the number of digits in your net worth / salary) depends on whether we’re talking about, say, lifestyle (where log-dollars do seem to be natural) or ability to donate to charity (where dollars seem to be natural).
It is not. The Swedish study does not regress wealth on wealth, but wealth rank on wealth rank. Pretty close to taking logarithms, just like GDP. They say that they looked at a bunch and this was the best. They couldn’t just take logarithms because many people have negative wealth.
I think this is an interesting piece, but there are some major errors of reasoning which I think you might commit and I’m sure that some of the commenters have committed after reading.
Some have already been pointed out, but the big one seems to be missing:
https://en.wikipedia.org/wiki/Ecological_fallacy
You cannot simply compare a correlation at state or country level with a inter-individual correlation. Some commenters, e.g. Arthur B., point out a process that can only happen at a state level, namely migration of smart people to wealthy states. That cannot happen inter-individually (which is what you seem to be interested in).
For me and some of my students that I tried this on, the point that best drove home the ecological fallacy (or its more general form, Simpson’s Paradox) was:
1. Across people, average alcohol consumption correlates positively with IQ test performance (at least in Germany).
Now, this surprises many people, and actually we may not really know what the reason for this is (e.g. maybe they have more money to buy alcohol or maybe they need it more to feel sociable at parties). What is clear, is that this doesn’t reflect people’s intuition about the causal role for alcohol on IQ.
Now we can add a regression and control for income, wealth and sociability, but it’s much simpler to simply look what happens intra-individually.
2. The more a given person consumes alcohol, his/her IQ test score (while drunk vs. sober) becomes worse.
That is the result that also holds up experimentally, because that is the true causal effect of alcohol on IQ test performance.
But shouldn’t this negative intra-individual causal effect also have some influence on the inter-individual level? Yes, you can make that inference! However, it’s entirely possible for different unobserved third variables (like wealth) to have a much stronger, positive effect on both IQ and alcohol consumption, leading to the negative association disappearing.
You may have heard all this before, but a lot of the potential inferential errors in this piece follow from this, so maybe it’s worth saying.
So, all you report here matches my expectations: a highly controlled design (adoptees vs. biological children) would usually yield smaller associations than a completely uncontrolled association at a higher level (as shown by the many commenters who are speculating on the various state-level processes involved).
From experience I also know that a lot of the state and country level indicators that people like to look at are highly correlated with one another, to the point that it’s often impossible (due to the small number of countries/states and multicollinearity) to squeeze out the added benefit of having high GDP over having high HDI (human development index), low GINI, low adolescent fertility rate, a smaller gender gap in institutions.
I don’t 100% know why this is, but a likely explanation is that all these things are seen as desirable by countries and their rulers/voters and that getting a high GDP allows you to bring the other things about.
Combine this with the fact that most psychological studies are in WEIRD countries (Western Educated Industrialised Rich Democratic) which are even more similar and correlated on all these indicators (i.e. there is rich, unequal societies, but you usually don’t get much psychological data from Saudi Arabia) and you know why most psychologists are wary of looking at country-level correlations to infer something about psychological processes.
I wouldn’t bet much on the association between adoptees’ wealth and their adoptive parents’ wealth being within +/-0.05 of the ones reported in Sweden in Burkina Faso or even the US.
Hi, Scott! A few comments:
1. Remember that the estimate in the paper is not a causal estimate. Saying “Holy frick, IQ is everything after all” probably implies that IQ is an exogenous variable that causes state GDP variations. But the entirety of the correlation in the paper might run in the opposite direction, meaning that it would be more appropriate to say “Holy frick, state GDP is everything after all”. More realistically, there is probably two-way causation.
2. 17% is actually slightly higher than what the paper finds. Using a bunch of different methodologies, the number they find is actually around 10-14%. Which still implies a correlation above 0.3, so your point is of course still valid, I just thought I should point that out.
3. Graphs can be tricky. You might think this graph shows a very strong linear relationship, but try covering up the small scattering of 8 states in the lower left: MS, LA, AL, WV, AR, TN, SC, and KY. If you cover those 8 points with your thumb, you’ll see that it now looks not much like a line, and a lot more like a fluffy cloud. But you’re still looking at 84% of the data. A small number of outlying points tends to draw the human eye.
4. I think Figure 9 in the paper gives a much better picture of what kind of GDP results we might expect from IQ changes. The light green bars represent the estimated effect of test scores, the black represents things we know we can control (schooling), and the gray – by far the biggest bars and the bars most varied in length – represent “other stuff”. Looking at this graph, as a policymaker, I think raising state IQ might be a priority, but not the highest priority by any means.
Cheers,
Noah
Somewhat confused – I also noticed the bunch of methodologies showing 10-14%, but I figured you would be better at interpreting than I would, and you said “What it shows is that the vast majority of differences in state income are not due to variations in state average I.Q. If we had an I.Q.-boosting device, boosting the average I.Q. of Ohioans by 1% would raise Ohio’s average income by at most around around 0.17%.”
Am I misunderstanding you?
The paper doesn’t do the kind of linear regression you’re imagining. They do something more complicated: they make a model of how they think growth works, and they use that model to infer a linear relationship between growth in IQ (test scores) and growth in GDP. The 17% number comes from that relationship, not from a simple linear regression of GDP on test scores. 10-14% is the percentage of GDP variance accounted for by IQ differences; 0.17 is their estimate at the size of the effect of changes in IQ (measured in percentage points of 1 standard deviation) on GDP growth (measured in percentage points).
(But because they assume GDP doesn’t causally affect IQ, this 0.17 number should be treated as an upper bound.)
A better way to think of this is that according to this model, if you used IQ-boosting technology to boost the IQ of Ohio’s population by 18 points – the commonly cited figure for the difference between the average IQs of Mexico and South Korea – you would increase Ohio’s GDP by about 16 percent, or $5,600 per person. Nothing to sneeze at, but not exactly world-changing.
Noah’s argument:
“What this really shows is that there is Something Else that is driving state income differences. My personal guess is that this Something Else is mainly “external multipliers” from trade (the Krugman/Fujita theory). Institutions probably play a substantial role as well (the Acemoglu/Robinson theory). That’s certainly relevant for the debate about different models of capitalism, where we often compare the U.S. to Scandinavia and other rich places.
“In any case, this result should be sobering for proponents of I.Q. as the Grand Unified Theory of economic development. … But for rich countries, there are things that matter a lot more.”
True, no doubt, but the problem of course is that “external multipliers” and “institutions” are less “things” than IQ is. “External multipliers” and/or “institutions” are likely important, but they are also extremely broad hand-waving conceptual bins in which to lump miscellaneous things that you can’t really measure other than to assign a lot of leftovers to them. We could make up lots of other names for useful catch-all concepts, such as “culture.”
In contrast, here in America we’ve been pretty good at measuring this thing we call IQ for the 99 years since Lewis Terman invented the Stanford-Binet test. We have a convenient method for coming up with a single number metric that turns out, when you create a scatter plot, to be strikingly correlated with all sorts of complex real world numbers like state per capita GDP.
Obviously, the IQ glass is part empty. But it’s much more remarkable that it’s part full.
By the way, it’s probably just a coincidence that the center of the global high tech industry is now the Stanford campus and that the “Father of Silicon Valley” is either Terman’s son Fred or Fred Terman’s pal William Shockley. But, then again, maybe there’s something about the culture of the Santa Clara Valley going back over 100 years that makes a cult of intelligence that, remarkably, has paid off over and over again.
Thanks, I’ve edited the post to reflect the correct statistic.
It’s really more about the fact that the people who wrote the paper are doing something very different than drawing a GDP-IQ scatterplot and then drawing a line through it. So it’s not an apples-to-apples comparison.
If you do draw a GDP-IQ scatterplot and draw a line through it, as you do in this post, the closest correspondence is to use the 14% number as the r-squared. So yes, it’s good to change that number from 17% to 14%. But the most important thing for readers to realize is that the people in the paper aren’t doing the same thing you’re doing.
In economics, many people use “counterfactuals” to summarize the importance of the causal effect of A on B. A counterfactual is when you ask the question “If we forced A to rise by a certain amount, what would happen to B?”. This is what I did with my Ohio example. I think it explains exactly how important population IQ is and isn’t in the model in the paper, without creating the kind of confusion you profess in this post.
In other words, I don’t think there’s any Stalin-esque vote-counting going on here. The size of the effect is very clear and easily explained.
Oh, and I think the caption of the graph should actually be: “Proposed new state motto: Maine – If intelligence were the key to riches, we’d be driving nicer cars!“
Proposed new state motto: “Minnesota — If we weren’t intelligent and cooperative we wouldn’t be here because it’s really cold.”
Actually, if you look at that graph, virtually all of the states with high IQ relative to GDP are far northern, heavily forested, very rural states. Maybe it’s not all that useful to be smart if all you’ve got is trees.
Another possibility is that there you’re seeing the actual effect of high IQ (which is not very impressive) due to low parasite load and/or demographics, and everywhere else you’re seeing a correlation with good education or something.
In my blog post, I gave a hypothesis as to what I think a big chunk of the “something else” might be: location in a geographic pattern of trade networks.
Yeah, but that didn’t look too plausible for me, and I don’t notice a stunning trade route difference in the states above vs. below the trend line – Nevada, Tennessee, and Georgia are above, but Rhode Island, Oregon, and Missouri are below.
I would recommend the work of Krugman and Fujita on this topic:
http://www.amazon.com/Spatial-Economy-Cities-Regions-International/dp/0262561476/ref=sr_1_2?ie=UTF8&qid=1438618031&sr=8-2&keywords=masahisa+fujita
It gets pretty math-heavy, but the first two chapters do a good job of communicating the basic ideas. In a nutshell, small historical differences can easily lead to large, enduring economic differences between regions. But don’t feel bad for the North Dakotans; they probably derive greater than average benefit from living in a wide-open, empty place.
“In a nutshell, small historical differences can easily lead to large, enduring economic differences between regions.”
No doubt. The general principle that past differences have led to present differences pretty much has to be true.
But how informative is it? Notice how much this resembles most tribes’ creation myths for the origin of the universe: small differences in the past lead to today’s large, enduring differences between the sky and and the earth, between day and night, man and woman. Something caused these current differences!
Scott writes:
“Yeah, but that didn’t look too plausible for me, and I don’t notice a stunning trade route difference in the states above vs. below the trend line – Nevada, Tennessee, and Georgia are above, but Rhode Island, Oregon, and Missouri are below.”
You are being overly literal. “Trade networks” to economists attempting to explain the world doesn’t necessarily mean canals or highways, the term today mostly means The Way Things Are. Silicon Valley, for example, is rich because it’s full of things that make Silicon Valley rich.
I wonder if people with high IQ are more likely to value lifestyle over wealth?
Brings Scott Adam’s “world’s smartest garbage man” to mind. 🙂
The cost of living tends to be low in very cold weather states, so the standard of living tends to be higher than it looks. Minnesota, for example, has a high material standard of living, assuming you can stand the climate. Florida, Arizona, California, and Hawaii have lower standards of living than per capita GDP would suggest, but then they have nice weather in winter.
“If we had an I.Q.-boosting device, boosting the average I.Q. of Ohioans by 1% would raise Ohio’s average income by at most around around 0.17%.”
This sounds like a regression coefficient, not the variance explained. Even in a linear regression, the two will be related but they are not the same thing.
Dan: Correct. The amount of the variance explained in their model is around 10% to 14%, while the effect size is 0.17 (actually a little lower). Obviously these don’t have the same relationship to each other that they would in a simple least squares setting.
Btw, Scott also interprets regression coefficients as correlation measures in the adoption study. This only works only if you have one explanatory variable and all the variables are normalized. It’s possible to get very high r^2 with very low coefficients on the explanatory variables if the variance of the explanatory variables are high.
Also, since both biological and adoption parent wealth are included in the same regression, the coefficients are really partial correlations if you want to use that word.
In terms of the variance explained, it’s really the biological and adoption parent wealth taken together that explains 14% of the variation of wealth rank of children.
In terms of explaining the results to a lay person, it’s better to start with the economic impact. e.g. if we increase the wealth rank of the adopted parent by one points holding the rank of the biological parent constant, we’d increase the wealth rank of the children by X points.
Then you can talk about the stastical significance. e.g. 95% confidence interval for the X estimate is Y and Z.
The R^2 generally will tell you very little.
Megan McArdle quoted one of her professors a while back as saying, “If you look at demographics long enough, you will find it accounts for 110% of all social phenomena.”
Really? Because when I take GPD and raw NAEP from table A2 of the paper, I get a correlation of only 0.27. It is only by adjusting for migrants (column 5) that I get a correlation of 0.46. And then it goes back down to 0.41 when adjusting for differential trends in NAEP scores. And back to 0.28 for column 7, using SATs.
(oops…I was supposed to exclude AK, DE, WY. Then all the correlations go up, but the correlation with raw test scores was still only 0.31 and the highest was not 0.54. And maybe I was supposed to weight by population, which I did not do.)
I always assumed that “not having a totally corrupt government” would be the #1 factor in income differences among countries. I don’t know where corruption comes from but I suspect it’s mostly cultural rather than IQ-related.
Aaaaaand what makes you think those aren’t correlated?
I think there’s a tendency to over-emphasize “book smarts” (IQ) in life outcomes among audiences like SSC where education level tends to be post-graduate and profession reflects this. Although above average IQ does seem necessary to work on the sexy, bleeding edge tech of the era (e.g. rockets, selfdriving cars) it would seem that crass day-to-day business is the driver of the wealth of nations; if we were going by achievements in space (or computer hacking skills), Russia should be second wealthiest country to the US.
Some of the profiles I read of Mitt Romney’s family history show an attitude I’d dub “enterprising” where wealth was accumulated in pretty bland ways: ranching, car dealerships, management consulting. This probably gives a more representative example of the population than the iconic Steve Jobs stories. I see this bias to hi-tech even in the discussion of AI, where the computer becomes a physicist and invents a Rearden Steel, as opposed to an online pornographer or property developer. “The only way doctors get really rich is through real estate” -Bill Gates
Book smarts contributes to all these endeavors. Bill Gates plays bridge with Warren Buffett, who got rich in the most boring possible way.
What about personality? That’s more important in business.
but even successful ‘low tech’ entrepreneurs probably have above average IQs. But you don’t hear as much about bland businesses in the news as you do about tech
Higher IQ correlates to greater success in pretty much every job, all else being equal. A smart janitor will get more rooms cleaned in his shift than a dumb one.
The two factors other than intelligence which seem to make the most difference to financial success are conscientiousness and sales ability. (Both of which seem to correlate with intelligence, but are independently valuable.) Bill Gates is really smart, but he’s also both very conscientious *and* has really good sales ability. There are programmers who are smarter than Gates, and many are his equal in conscientiousness, but most aren’t as good at sales. The Romneys who were ranchers (really?) are probably smarter than most other ranchers.
Speaking of bias, there’s also a large bias both here and in most other communities where there are lots of people with advanced degrees against attributing high intelligence to very successful people who don’t have very high academic achievement. Many of the smartest people I know stopped after a bachelor’s degree, often from a second-string university, but have done quite well because they turned their intelligence to making money. Management is an intellectually demanding skill that many otherwise smart people can’t do, and don’t recognize as being intellectually demanding.
For a graph of the most recent PISA scores across a wide number of First and Second World countries, see:
http://isteve.blogspot.com/2013/12/graph-of-2012-pisa-scores-for-65_4.html
It’s kind of weird to repeatedly credit an article to The Atlantic even though it has a listed author. Joe Pinsker’s name ought to be in this post, especially since a lot of your readers are going to conclude that the piece in question is severely incautious in generalizing from the research findings. We should know who to blame.
I don’t like blaming people.
OK, then credit Joe Pinsker for Joe Pinsker’s irresponsible science journalism.
It doesn’t make sense to attribute an article with a byline to an institutional author. You wouldn’t say “The New York Times’ post” when you were talking about something Krugman wrote. Why do it here?
It’s not like the Atlantic respected Joe Pinsker’s expertise so much that they would publish his article no matter its conclusion.
If Pinsker hadn’t messed up, The Atlantic would have found some other idiot whose misunderstanding of the science happened to lead to the conclusions The Atlantic likes.
Therefore, blaming The Atlantic makes sense, because there are way too many idiots doing journalism, but not that many popular publications.
So the bad science journalism is really a function of management wanting to push bad science journalism, for ideological reasons, and Pinsker is just their current mouthpiece? That sounds like attributing to malice what is explicable by incompetence.
I think it’s more likely that the bad science journalism is a function of having hired an incompetent science reporter. That it would be possible for The Atlantic to get better science journalism, by hiring a more competent science reporter.
And I think it’s important they do this because, as you say, there aren’t that many popular publications any more. It’s wasteful to have Pinsker filling the science reporter slot at one of them.
How many good science reporters are there, really? (How many good reporters of any sort are there, for that matter?) Keep in mind that scientists, university public relations people, et al. all have incentives to make their work sound as important and definitive as possible; meanwhile, even if a science reporter wants to be as accurate and truthful as possible, she has incentives to write things that people want to read. (The Cochrane Collaboration can get away with saying “more research is needed” for everything; Buzzfeed can’t.)
Pinsker isn’t a science reporter, he is an editor who covers business.
I think this means that all of his content can be considered editorials, and as such, they represent a point-of-view and are not simply reporting. Much of the content The Atlantic would fall under this rubric, and the publish a number of viewpoints that cover a fair amount of the spectrum. Conor Friedersdorf and Jonah Goldberg are regular contributors, for example.
No, “editor” is meaningless title. Journalists at magazines are often called “contributing editor” even though they do no editing. “Associate editor” is a lower-level title and might mean that he really does grunt-work editing in addition to writing articles like this one.
It is true that magazines are not newspapers and are not simply reporting the news.
@Douglas Knight:
That’s a fair point. I’m not up on the job title conventions in media these days. Still, his beat is business not science, and a brief perusal of some of the other things he writes seems to be sort of a smorgasbord of more or less interesting nuggets (including the two times squirrels stopped stock trading in the U.S.. It seems more of a blog type approach, rather than an attempt to cover the most import things in a topic.
As such, I think it is still fair to characterize his writing in the opinion category. Certainly he ends some of his pieces with opinions that are clearly his, and not simply a reporting of the opinion of someone else.
I think that this paper counts as “business” rather than “science” because it was written by economists.
He just posted another article about a social science paper. This time it’s about appearance and crowdfunding on Kiva with a title that’s not completely supported by the article.
How to Succeed in Crowdfunding: Be Thin, White, and Attractive
The biases of the online marketplace, quantified
http://www.theatlantic.com/business/archive/2015/08/crowdfunding-success-kickstarter-kiva-succeed/400232/
Having complained about Pinsker, I recognize that it’s probably now incumbent on me to go through that one and see how well he does (trying to judge objectively).
I’m not going to do that, because after following links through other news reports to their source it looks like it would be around 10 studies to read, and I have another project today. I acknowledge my dereliction of duty in my recently self-assigned role as Judge of Pinsker’s Reporting. Sorry.
ETA: The very fact that he’s reported a piece that eventually sources to 10 different studies is points in Pinsker’s favor though.
Usually, the publication writes the headline and not the writer. If the headline is the problem, then we should be blaming The Atlantic.
Reporters/journalists/columnists don’t write the headlines, as has already been pointed out; that’s editors/sub-editors. And they go for an attention-grabbing line that may or may not be borne out by the body of the article, e.g. if there’s a piece about general nutrition and healthy eating that includes the sentence “Turnips turn out to be good as one vegetable to boost fibre in your diet”, the headline will scream “Turnips – nature’s miracle weight loss food!”
It’s even worse for online pieces, where they live and die by getting readers to stop and click on that particular article so they need something that will make you go “What?”
I really don’t think he was that bad. I think he stressed a certain aspect of the study, maybe a little more than seemed proper, but he didn’t misrepresent findings or lie about anything. If we grade science journalism on a curve, that’s solid B+ territory.
I agree that this is about the Atlantic’s institutional biases, and the Atlantic can’t feel bad if I yell at them, so I continue to be satisfied with blaming the Atlantic. Hounding a poor not-so-bad journalist out of the profession changes nothing; getting the Atlantic to change the way they do things changes a lot.
If you are interested in test scores by state, Audacious Epigone is the place to go. For example, here are federal NAEP test scores by state for just white kids:
http://anepigone.blogspot.com/2015/02/state-iq-estimates-whites-only-2013.html
Most states’ white students are pretty average on average, but the gap in average white scores between Massachusetts and West Virginia is close to 2/3rd of a standard deviation.
I actually double-checked with a state IQ dataset you posted somewhere, and it correlated with this study’s at 0.96.
All cognitive tests correlate fairly well.
“Stalin was totally all about coming up with the witty self-aware evil-despotism-related quotes. Huh.”
Stalin was a funny guy. Seriously. He apparently modeled his prose style on the sarcastic prose of the letters of Ivan the Terrible, who was also a funny guy.
Also, Germans apparently found Hitler hilarious, but Stalin’s mordant black humor strikes me as funnier.
Well, past a certain wealth level, maybe the motivations for giving a kid up for adoption change? i.e., “oh god the kid’s gonna be retarded” instead of “oh god I can’t afford it”?
I think scatter plots are generally the best way to convey this kind of data. I don’t think the State-IQ graph makes it look like IQ explains everything, at least not if you’ve spent a lot of time looking at graphs; there is a lot of variance between the states. Similarly, the most interesting thing to me about the Swedish wealth graph is how there is much less variance w/r/t to adopted parents and wealth vs the biological parents. The confidence interval for the first graph (adoptive parents) seems really tight.
Something helpful I wish more studies did would be to provide series of graphs for a variety of factors, as it is very easy to selectively cite data to tell the story you want. It’s a lot more work, but if you can back up your hypothesis with a dozen different measurements it’s much more convincing, and often it reveals a much weirder reality than what can be shoved into a five hundred word article.
I wrote about cancer rates in US states compared to smoking. The correlation coefficient was .248. But if you looked at cancer death rates r=.891. I’m sure this has been studied to death, but it was new to me. In this case we know how bad smoking is for you (and dang, r=.891!), but if the empirical research was murkier and the numbers not quite so divergent you could plausibly tell whichever story you wanted. Really what we need in cases like what you’re writing about is better data, as statistical tools can only take you so far.
Your link back to your post on the Leslie et al study reminded me: Leslie and Cimpian have responded to a similar criticism of their paper in a discussion note.
The critical comment:
http://www.sciencemag.org/content/349/6246/391.2.full
Leslie et al. (Reports, 16 January 2015, p. 262) concluded that “expectations of brilliance” explained the gender makeup of academic disciplines. We reestimated their models after adding measures of disaggregated Graduate Record Examination scores by field. Our results indicated that female representation among Ph.D. recipients is associated with the field’s mathematical content and that faculty beliefs about innate ability were irrelevant.
Their response:
http://www.sciencemag.org/content/349/6246/391.3.full
Ginther and Kahn claim that academics’ beliefs about the importance of brilliance do not predict gender gaps in Ph.D. attainment beyond mathematics and verbal test scores. However, Ginther and Kahn’s analyses are problematic, exhibiting more than 100 times the recommended collinearity thresholds. Multiple analyses that avoid this problem suggest that academics’ beliefs are in fact uniquely predictive of gender gaps across academia.
Do you have further thoughts about this issue?
I think my analysis is immune to the colinearity argument since I only look at one thing.
OOOOPS, you’re right, that part doesn’t have anything to do with your argument.
They do say something that seems potentially relevant in their reply:
“The results displayed in Table 1 make it clear that academics’ ability beliefs are a significant predictor of female representation above and beyond whether a discipline (i) requires mathematical ability (as indicated by the quantitative GRE score) and (ii) privileges this ability relative to verbal ability (as indicated by the quantitative:verbal ratio or the quantitative−verbal difference) (see, e.g., models 7, 8, 9, 20, and 21).”
“Privileges” is an interesting choice of word. Tells you something about the authors’ view of the world, I think.
What is the x-axis in figure 8? It is called “Test Scores,” but it does not seem to correspond to any of the columns in Table A2. In particular Louisiana has a score just over 400 in the graph, but not in any of the columns.
I find that the correlation between the GDP listed in Table A2 and the Test Scores in the same table are: 0.27, 0.26, 0.46, 0.41, 0.28. After excluding AK, DE, WY: 0.31, 0.30, 0.54, 0.52, 0.37. The scatterplot from column 6 looks most like the scatterplot in the paper, but the x-axis has shifted by 20 points. (regression line does not exclude the 3 states) CSV.
(I probably should have weighted these by population. But that is irrelevant to the question of the x-axis.)
Statistical analysis is a horribly abused field of applied mathematics and your post highlights why this is so. It’s original efficacy was essentially to inform decision-making and hopefully achieve better (or desired) outcomes. It later was applied as an aid to interpretation of experimental data, and used to improve understanding of physical phenomena. In neither of these endeavors was there any expectation of certitude or revealing a definitive truth.
During the past half-century, however, the field of journalism has co-opted statistical science in service to sensationalism and selling a media version of “knowledge” that implied the revelation of a higher truth. This is nothing more than journalistic propaganda hiding behind a patina of science, and should be viewed as a derogation of ethics.
There is an alternate explanation to Stalin being particularly self-aware of being an evil despot.
The man was profoundly anti-liberal. He fundamentally believed that liberal institutions like free press and representative democracy could not serve the masses, but would ultimately be co-opted by the bourgeoisie and used as tools of opression.
Of course, the man did famously fudge elections himself. At the 17th party congress, he was surprised to receive a very large number of negative votes. He immediately falsified the results. The congress was later known as the congress of the condemned, as during the purges a third of those present, and more than two thirds of those elected during the congress got executed.
I’m no expert, but there may also be a cultural factor at work: all the Russians I’ve ever met enjoy expressing very cynical, “cold-eyed realist”-type attitudes about politics. Of course, this may be because of Stalin to some extent, but it probably predated him.
Thus, as we see with Putin, being openly Machiavellian may be perceived by the Russian public in a more positive light than it would be here: a way of signalling that you are tough and serious and mean business, etc.
I recall on a vacation to Russia someone asked our tour guide: “why do none of the shopkeepers ever smile?” He replied, “Russians think that if someone selling something smiles at you he is probably out to cheat you.”
The famous Russian cynicism about politics is at strange odds with their wildly romantic nationalism. My best approximation is thus: “Our leaders are shit, and we’d like them to be in charge of everyone else too!” I don’t know if it’s just ideological blinders or a “misery loves company” thing, but it is really weird.
You’re conflating nationalism with imperialism here.
And this was the 1920s and 1930s when democracy’s successes as a viable, effective, system of government was much less obvious than it is today.
Isn’t there an extremely obvious reverse causation in the IQ/GDP thing that wealthier countries/states could lead to a more intelligent populace? Not just through better education but also better nutrition.
In US states that would seem really unlikely to be important, esp. regarding nutrition.
There’s a simpler reverse causation. Intellectual ventures (technology, medicine) have been leading GDP growth in the US. The states which have jobs in such industries attract smarter people than the states which don’t.
It’s even more pronounced at a local level. NYC or San Francisco don’t have a high GDP because they’re naturally gifted with a pool of smart people, they attract smart people because of the type of industries that bring about this high GDP.
As I mentioned elsewhere, that’s likely to work both ways. High-tech industry attracts smart people and generates wealth, but high-tech industry requires smart people with wealth to grow. Or even to establish in the first place. The interesting question is why this virtuous cycle takes place in some regions but not in others. I only half-jokingly suggested natural harbors and navigable waterways, am open to others.
Nowadays I think the presence of favorable institutions and legal regimes is even more important, probably, than it was in the past because it is much easier for bigger corporations to move, and “knowledge” and entertainment (more portable than coal and corn) are bigger sectors of the economy. Look at the movie industry filming everything in Louisiana, all the corporations in Delaware, etc.
You may be the first person ever to praise Louisiana’s institutions.
“Vote for the crook – it’s important!”
Hah! Well, I actually don’t mind outright corruption and graft as much as moral highground-claiming busybodies, so I would actually prefer the institutions of Louisiana to those which prevail in MA, NY, or CA.
Sure, natural harbors and navigable waterways, but not directly; that’s why NYC got established as a city and started the first such cycle. Which attracted other wealth, and many of these cycles got going, and they build on each other. New York’s never collapsed entirely. Contrast Detroit; there were similar virtuous cycles, but less diversified since they were pretty much all built around the automobile industry.
Silicon Valley is on at least its third high-tech iteration now — semiconductors, personal computers, and now Internet/Big Data/Cloud. The first happened there probably because of Stanford, the second two built on their predecessors.
There are two popular Origins Stories about Silicon Valley: one involves William Shockley and Intel, the other involves Stanford dean Fred Terman and HP.
http://takimag.com/article/silicon_valleys_two_daddies_steve_sailer/print#axzz3hcDL5S7T
Interestingly, Shockley and Terman were friends and shared the same controversial views on IQ and heredity, which go back at least to Fred Terman’s dad Louis, the inventor of the Stanford-Binet IQ test.
The location of Stanford is anything but arbitrary. The geography of the west coast dictates that the Bay Area will be the commercial center of a hugely productive chunk of 19th century North America, which will attract and/or create a whole lot of rich people with nothing better to do than support the finest university in the 19th century American west.
William Shockley is slightly more arbitrary; he apparently set up his business in the Bay Area because his sick mother lived in Palo Alto. But then, she was a Stanford grad.
The 1840 bestseller “Two Years Before the Mast” by Harvard student Richard Henry Dana who had sailed to California in the 1830s made a very big deal about how the San Francisco Bay area was just about the best place for human habitation in the whole world and … there were very few people near it and even fewer people loyal to the government of Mexico.
Not surprisingly, 8 years after the book’s publication, the Bay belonged to the U.S.
Ahem. I think you mean “Louis Terman, who developed a revised version of the Binet-Simon test”. Don’t erase Alfred Binet in the fervour of American exceptionalism! 🙂
The right number to quote would be the mutual information, but there is no (tractable) model free way of getting it. However, there are good approximations, especially in 2D.
Im not a statistician, so Im punching way out of my weight class, but it seems to me that a lot of these stats ignore significant time factors.
The off the top of my head example is “crime has been dropping for decades!” It has- sine the late sixties…..when it took a huuuuuge spike.
And wealth, addiction, murder, business ownership in the black community was exploding as segregation started going away- and then keeled over and plummeted in the late sixties. I dont think they got dumber, I think other factors happened.
+cough+ welfare and the subsequent collapse of the family+cough+
Honestly….scott, how much would you want to do a post analyzing the effects of marriage – because my own research (and uneducated statistical research is like uneducated nuclear research……you feel a lovely warm glow for all the wrong reasons) seems to put “marriage” somewhere around “college education ” as importance for life outcomes.
If we’re talking about the US, the crime rate continued to rise through the 1970s and has only been falling since about 1990.
Like college education, the natural question is “treatment effect or selection effect?”. Yes, there is some change that happens to people when they marry, but there’s also the information that someone else who knows them intimately decided they were worth allying with, which tells you a lot relative to people where that *isn’t* true.
And chasing the certificate rather than the root cause has issues associated with it–think politicians promoting home ownership because of all the neat correlations between home ownership and nice things, or promoting college education because of all the neat correlations between college degrees and nice things, and so on. It seems like the marginal couple deciding whether or not to marry should not marry, and encouraging it will have troubles. (Encouraging better couple formation, on the other hand, seems like a good place to put more attention.)
That is true- but I also think there are other factors. College can provide you with lots of useful life skills. I mean- there are entire classes that literally focus on teaching you HOW to think, in every discipline except maybe a few of the flightier liberal arts courses. (even then, you usually end up in philosophy 101 at some point).
In other words, education has value well beyond the “signaling intelligence” level, much of which can have practical everyday applications, if only in the ability to go “wait a second….”.
Marriage is the same deal- I suspect a lot of the outcomes are A. it’s cheaper. B. It’s more convenient- lose a job? Room to pick up the slack. Need to get a kid to thedoctor? Twice as likely to be able to get time off. Grocery shopping, cooking, encouragement- there’s a million little ways in which having someone else with equal skin in the game helps.
I’m not saying it’s all that way- but I suspect that yes, the marginal couple would see distinct benefits from getting married, and staying married…..which is the clincher.
A bigger part of the selection effect when looking at marriage is likely to be pre-existing outlook on life and personal responsibility, particularly when you focus specifically on people who got married before they started having children versus people who had the kids first and married later or never. Just off the top of my head, people who marry before they have children are much likelier to (a) value long-term stability and financial security, and (b) know what behaviors generally promote long-term stability etc, and having both of those traits is most definitely an advantage in achieving better life outcomes.
Lately, it seems that every new study about social mobility further corrodes the story Americans tell themselves about meritocracy; each one provides more evidence that comfortable lives are reserved for the winners of what sociologists call the birth lottery…What appears to matter—a lot—is environment, and that’s something that can be controlled
It’s the meritocracy within the birth lottery; the two need not be mutually exclusive. Look at the Silicon Valley tech culture, which epitomizes the meritocracy, but is mostly restricted to high-IQ people. Lower IQ people also have their meritocracies within their own IQ caste.
If we accept that the state-level correlation is significant even though the individual correlation may not be, we will obviously be inclined to speculate about causation.
“Obviously”, the correlation is because all the smart people are generating massive wealth, while the stupid people are squandering or even destroying it. Shift the smart-stupid ratio a bit towards smart, and watch the money roll in.
Except, it’s just as “obvious” that all the smart people are moving to the places where there’s more money to be had, because Duh! Even poor people can figure that out, but they won’t be ahead of the curve on figuring out where the money is going to be next year and they’ll have a harder time managing the logistics of an interstate move.
But then there’s all the other, and more interesting, possibilities where some third factor causes both increased wealth and increased IQ. Presence of high-tech industry would be an obvious candidate, except it’s not clear which way causality points on that one. So, just for fun, let’s look at the less obvious ones.
I’m going to throw out “presence of natural harbors and navigable waterways”. Trade is more profitable and more brainpower-intensive than most forms of straight material production, so natural transportation hubs will tend to concentrate both riches and smart people. Looking at the scatter plot, at the top right we have New York (NY harbor, Hudson river system, Erie canal), NJ and CT (economic suburbs of New York), Massachusetts (Boston harbor), California (Bay area + central valley), Washington (SeaTac), and Illinois (connects Great Lakes w/Mississippi river system). And the interesting outlier of Louisiana, with high average wealth in spite of the second-dumbest population in the list, and gee, might there be an interesting bit of hydrology involved there?
OK, it’s probably not just navigable waterways, though now I’m tempted to figure out what metric I should use to graph that. Other candidates, everyone?
Water-route imports and exports as proportion of state GDP?
But this brings up Ezra Klein’s critique of Scott’s piece on racial bias in policing. I.e. the waterway trade is a method by which the IQ advantage crystallizes, which doesn’t really mediate the importance of IQ on GDP, just gives us more information on where it is specifically advantageous.
Noah Smith writes:
“The upper bound for the amount of state income differences that can be explained by population I.Q. differences is about a third. If we assume that achievement scores are a good measure of I.Q. and that school attainment doesn’t improve I.Q. very much, then the number goes down to about one-sixth.”
One-sixth is a lot when it comes to the incredibly complicated subject of understanding human affairs.
Waterways were hugely important, especially before railroads really got going. For example, Chicago is the biggest city between the coasts because it’s on the very low continental divide between the Great Lakes and the Mississippi River basin. Fur traders only had to portage their canoes about a mile. In the 1830s a canal was dug in what are now Chicago’s southwest suburbs linking the two most important watersheds of North America.
But navigability is kind of a contingent crapshoot as well. For example, another historically important portage site between the Great Lakes and the Mississippi Valley is Fort Wayne, Indiana. Fort Wayne thus became an industrial hub of some degree of importance, but didn’t acquire the financial exchanges, airports, and universities that Chicago wound up with.
But it’s easy to imagine an alternate history in which we debate the the theories of the Fort Wayne School of economists like Milton Friedman.
I ran my own analysis of some of this data, which I didn’t mention because I’m terrible at analyses and don’t want anyone to take me seriously. One of the things I included was a fake measure of navigability – states got two points for being on a coastline, and one point for each Great Lake or major river.
In my model, navigability was about half as predictive as state IQ. It really wasn’t that impressive. I tried a couple of other measures of navigability and they didn’t do much better.
Well, I was half-joking when I suggested navigability, so I suppose it’s about right for it to turn out half as predictive as IQ. But now you’ve gone and started doing the math, gosh darn it, and I can’t stand seeing the math half-done 🙂
OK, two points for coastlines obscures some pretty huge distinctions; without steel and steam and lots of heavy machinery there’s no good way to connect Oregon to the Pacific Ocean. And rivers offer even more diversity. So I’m going to try and quantify this, and I’m going to set the rules up first so I won’t be fixing the points to the curve.
X axis, total navigable distance accessible to a state’s ports, river, lake, or ocean. Inland navigable waterway distances per NOAA; it’s navigable iff they say it is. Count the full length of the system excluding downstream tributaries. Great Lakes includes the Saint Lawrence to Quebec City. “Navigable distance” for oceans will be taken as the square root of the ocean’s total area. But, only fully accessible through natural harbors on this list. Navigable river mouths not associated with a notable natural harbor count half, bare coastline counts one-quarter. Count only the best harbor in a state.
Y axis, average per capita GDP over the years 1997-2014; I’d like to go back an even twenty years but the Bureau of Economic Analysis changed their methodology in 1997.
Linear regression with variance, once by state and once normalized by population, and see what comes out. Will report back in an hour or two.
And now, as promised, the answers:
OK, first, one more rule. Hanushek et al have semi-arbitrarily excluded Alaska, Delaware, and Wyoming from the dataset. I’ll do the same at first.
Average per capita GDP comes to $39411 + $0.8407/km navigable, with variance (R^2) of 0.277; not bad for social science.
But treating all states as equal and then throwing out three little ones for being unequal, seems kind of fishy. So with all 50 states included, but weighted by population,
Weighted average per capita GDP: $38336 + $1.0155/km navigable, variance (R^2) of 0.415; almost half the relative wealth of US states explained in one geographic metric.
And now let’s get really weird: Hanushek et al give us state-level test scores, normalized and adjusted for fairness in ways I’m not going to argue with. So, IQ vs. navigable waterway length, anyone?
Weighted average NAEP score: 430.9 + 0.00180/km navigable, variance (R^2) of
(drumroll!)
0.603
OK, I’m going to want to check my math on this after a good night’s sleep. But it’s looking like most of the state-to-state variability in Adjusted Tested Smartness is due to proximity to navigable waterways. And yes, Louisiana is by far the biggest outlier here.
And there’s not much room to question the direction of the causal arrow here; the rivers came first[*] The smart people are preferentially moving to the places where the maritime trade routes come together. Which is also where the wealth is being generated or at least concentrated, but Louisiana suggests you don’t need smartness for that. Maybe the smart people go to places where they can tap into all that wealth without having to live in a swamp…
[*] Modulo a bit of tweaking by the Army Corps of Engineers.
This is actually really interesting, since I thought the study tried to adjust for migration. If IQ is correlated with navigability, the only way I can think of where that would have happened is through migration, so maybe they didn’t adjust enough.
These adjustments have nothing to do with answering the question. The adjustment is just to answer the question: how smart are the workers today, regardless of why they are there.
So…the study does nothing to rule out either “high-IQ immigrants go where the money is” or “low-IQ immigrants go where the money is”?
Simply taking the correlation between IQ and GDP tells you nothing about which causes the other.
The study did something much more complicated, but I assume that it is pure noise.
I don’t understand your question. It seems pretty easy to observe that both low- and high-IQ immigrants go where the money is, at least today. Internal migrants also go where the money is and they tend to be high IQ.
As feared and promised, checking the math a day later reveals an embarrassing indexing error in the math, such that the correlations are not as strong as first reported. But still significant.
As for migration, Douglas Knight is correct, the study’s migration correction factor is intended to give the average “smartness” of the current adult population. If, e.g., the entire adult population of Mississippi (mean IQ = 90) were to migrate to Massachussets (mean IQ = 110) , and vice versa, a crude review of high school records would show Massachussets having a 20-point edge over Louisiana because all the high test scores were recorded in MA schools, but Hanushek would correctly report MS as having the 20-point lead.
But back to my crappy math. Redoing the linear regression with the mistake fixed, I get the following variances – for all states, including the obvious outliers, but weighted by population, and for GDP averaged over the past 17 years rather than a point measurement.
Adjusted NAEP Score vs. GDP, R^2 = 0.3647
Navigable Waterways vs. GDP , R^2 = 0.4147
Waterways vs Smartness, R^2 = 0.1272
Since the waterways came before the smartness, the GDP, or any other plausible common factors, it looks like access to waterways is responsible for ~40% of a state’s wealth, of which about a third is due to the waterway-induced smartness of the local population. Non-hydrological smartness is good for another ~25% of a state’s wealth. All usual caveats for armchair statistics apply, and I’m going to want to poke at this some more.
Sorry about the exaggerated claim last night.
The potential for canal-building was an obsession of America’s Founding Fathers. For example,
“Few ventures were dearer to George Washington than his plan to make the Potomac River navigable as far as the Ohio River Valley. In the uncertain period after the Revolutionary War, Washington believed that better transportation and trade would draw lands west of the Allegheny Mountains into the United States and “…bind those people to us by a chain which never can be broken.””
https://en.wikipedia.org/wiki/Patowmack_Canal
The point about waterways is potentially useful because it maps to more than just inter-state differences in GDP. Most capitals seem to be located near major rivers or bodies of water and countries with coastlines tend to do much better economically compared to landlocked countries. George Friedman (the Stratfor guy) argued that one of the major sources of US power is the presence of major coastlines on both the Atlantic and Pacific oceans.
And, as Ben Franklin repeatedly pointed out to the British government in the 1750s, the interior of North America was quite accessible by the watersheds of the Mississippi (including the Ohio River) and St. Lawrence (i.e., the Great Lakes). Moreover, the two watersheds are easily accessible from each other. Franklin argued that whichever power controlled the American interior would rule the world in the 20th Century, thus making it crucial to Britain that France not be allowed to control either of the bottlenecks: Quebec and New Orleans.
Many state capitals are located at the “Fall Line” – the furthest upstream you can navigate without dealing with rapids, which is an advantageous place to collect produce from inland farms for shipment elsewhere. (Besides the obvious East Coast capitals, Sacramento and St. Paul are on fall lines.) However, many of those cities are not the largest or richest cities in their states.
The theories underlying this go back a long way, but one theory is that cities serve to concentrate the wealth that is extracted from a large hinterland – and the larger the hinterland, the wealthier the city. In the analyses I’ve seen based on this underlying concept, the reason that New York pulled away from Philadelphia was the Erie Canal – it made New York’s hinterland absolutely enormous.
Obviously, good water connections make for cheaper transportation and hence enlarge the possible hinterland.
The San Francisco Bay is a pretty good natural harbor, but the river system attached is nothing to write home about — in terms of inland trade, San Francisco would have had no more potential than Portland, Oregon or Mobile, Alabama if it wasn’t for a certain natural resource discovered in the Sierra Nevada foothills in 1849. San Diego is similar, but moreso.
And the other major cities in California are even less explicable in terms of hydrology. Los Angeles has the busiest deepwater port in the United States, but it’s almost entirely manmade; before it was dredged in the late 1800s, San Pedro Bay was an insignificant little divot in the coastline, barely navigable and too shallow for large ships. Sacramento lies on the eponymous river but is otherwise totally unremarkable. San Jose doesn’t even have a harbor; the part of the Bay it’s on is all mudflats and has never been dredged.
Los Angeles exists because it’s a sizable piece of mostly flat land within a Mediterranean climate zone. From the arrival of the Southern Pacific in 1887, huge numbers of people showed up for the climate and assumed they’d figure out a way to make money and that civic leaders would figure out how to bring in water. Its artificial port now dominates San Francisco’s natural one because it’s easier for trucks to get out of Southern California over low desert passes than out of Northern California over High Sierra passes.
The LA Basin is pretty nice land for a lot of things, but that’s not adequate to explain the presence of a major city — the Salinas Valley, for example, has equally good terrain, and there’s nothing there but artichokes and penal facilities. LA’s status as a Southern Pacific terminus didn’t hurt its early development, but I’d point to oil before that as a way of explaining its megacity status.
Greater Los Angeles is California’s largest metropolis because the 1906 earthquake took out San Francisco right about the time California had to figure out where to put all its new industrial development. Absent that, the good climate and isolated location gives you another Monterey or Santa Barbara.
Otherwise, the Bay Area has all the advantages. Gold rushes mostly just produce ghost towns, but the Central Valley is responsible for eight percent of the US’s total agricultural productivity by value – more than all of Oregon and Alabama combined, by a factor of two. The Bay is the finest natural harbor on the West Coast, superior in its natural state to Los Angeles with megatons of concrete and dredging, and San Francisco was the original terminus of the Central Pacific railroad.
Climate is for the places you grow the stuff to buy and sell in the city. Actual centers of commerce, the places where smart people make fortunes, those will be built in a swamp if the river that feeds it is good enough. Even solid ground is optional if the trade routes are right (see also New Orleans, Venice, Amsterdam…)
But one lesson of the 20th Century is that traditional features like navigable waterways are less important. Southern California exploded in population from 1887 as largely a series of real estate developments attractive to affluent Midwesterners and Easterners. Eventually, they figured out profitable things to do like make airplanes and movies.
Dallas would be an even more striking example of a vast self-willed commercial center. (It’s connection with the oil industry — c.f., J.R. Ewing — is marginal.)
In the 20th century, we developed the ability to build great cities in remote and/or inhospitable locations, if we really wanted to. Only rarely did we really want to do that; mostly it was easier to improve on our existing cities.
The Bay Area recovered pretty well from 1906, and experienced a boom in the 1920s. What made L.A., besides the weather, wasn’t the decline of the Bay Area. Oil is probably a big part of it – until WW2, the L.A. basin was an oil-exporting region.
Oilfields get you cities like Midland-Odessa or Bakersfield. Mediterranean climates with nice beaches get you cities like Santa Barbara or Monterey. A city like Los Angeles needs something more.
I should probably have spent a little more time on the Gold Rush. The Sierra foothills are covered in ghost towns or near-ghost towns from that era — I grew up in one. Once the shallow sources of gold dried up (or were banned, in the case of hydraulic mining), there was simply no reason for those towns to exist; those that could diversify did, and those that couldn’t died. The Gold Rush’s lasting influence on settlement patterns didn’t happen in the goldfields; it happened further down, where prospectors would disembark, or resupply, or settle down once they got sick of trading little pouches of yellow dust to grinning merchants peddling whisky and shovels and blue jeans at exorbitant prices.
Sacramento is probably the purest example of such; it was a tiny little agricultural colony in 1848, barely large enough to be called a town. But when gold was discovered fifty miles up the American River, it happened to lie where that river (which is too swift and rocky for anything bigger than a canoe) met a navigable waterway. So it became the natural jumping-off point. San Francisco at the time was a mission town of a thousand people, significant only for its presidio, but it had the deepwater port on that route.
Both cities grew hugely within a couple of years. When the goldfields dried up, they’d developed the infrastructure to handle large amounts of people and even sprouted some industry of their own — Levi’s jeans and Anchor Steam beer are two survivals from that era. So they were already the natural coordination points as northern California transitioned to a more diverse economy.
Los Angeles experienced its own resource boom a few decades later. The difference there was that it could serve as its own staging area.
Oilfields get you cities like Midland-Odessa or Bakersfield. Mediterranean climates with nice beaches get you cities like Santa Barbara or Monterey. A city like Los Angeles needs something more.
Los Angeles is what you get when you have both. And you have a political and social climate that is very, very business-friendly, in a way which helps people start their own businesses.
I count two cases of apples vs. oranges here. First, the state-GDP correlation is with IQ specifically, the individual-income correlation is with parental income. Even looking specifically at biological parents, the kids are going to be inheriting more than just IQ – which we can only weakly infer from the parent’s income in the first place.
Second, even red states have social welfare mechanisms that are pretty much deliberately set up to moderate differences in innate ability. Not just by transferring money from rich people to poor people, but by having rich people pay for schools that provide free education to poor people (and if need be tailored remedial education to low-IQ people). Even adoption itself, which as you note tends to provides high-quality parenting to the biological offspring of low-quality parents. So if you inherit a low IQ, there are powerful forces at work to make sure you don’t suffer too badly for it. And if you inherit a high IQ, you’ll be paying for that.
But at the state level, if everybody has a low IQ, or averages to a low IQ, that’s pretty much it. Indeed, ince there are transactional costs to any sort of welfare spending, bringing up the individual outcomes of a state’s disproportionately low-IQ population will diminish the state-level performance even further.
So we would expect the state-level correlation to be much stronger than the individual. Indeed, we’d kind of expect the individual correlation to be no more than barely statistically significant, because if it were more than that, state policy would be deliberately adjusted to target the disparity.
So if you inherit a low IQ, there are powerful forces at work to make sure you don’t suffer too badly for it. And if you inherit a high IQ, you’ll be paying for that.
yup..that’s one reason why America has a growing entitlement spending problem. The problem is that due to automation and other economic factors, the cognitive demands for middle-income work may rise beyond a certain threshold (shifting overton’s intellect window), requiring that even average-IQ people, who are not smart enough to find good-paying work, need transfers.
I doubt it’s just IQ. Look at the tech offshoring. Greatest returns are to above-average IQ with excellent interpersonal skills (business).
Amazing how America can have a problem with spending on welfare while at the same time having a problem in terms of providing welfare when compared to other first world countries (e.g. with healthcare and education). Sad.
Huh! When you hear “…only explained 17% of the variance” it sounds like “go home, this is boring,” but when you hear “correlation of 0.4″, it sounds like “huh, they seem pretty related”, and when you see the graph, it looks like “holy frick, everything is IQ after all”. But all of these are the same finding!
To me, it seems that much of this has to do with a wider grasp of the subject under discussion.
The variance/correlation/r issue was explained to me this way:
Take the number of feet a person has. Now, It Is Known that we have two feet (vs none or four or six or a hundrt) because of our genetic makeup. Two is the number of feet which a person has, because that’s how humans are constructed. It’s not something that Frith hands out to us.
Yet we have people who do NOT have two feet. Some have none, some have only one, and a very very rare fraction has three or four feet connected to the same noggin. That a person has two feet is overwhelmingly due to a genetic portion. But an overwhelming percentage of people who have feet numbering other than two (which is not very many) are in fact genetically predisposed to have two feet. It is something else – a drug their mother took, an IED, diabetes, a crocodile, *something* – that put them in the current position of having feet numbering other than two.
So the primary correlation between “two feet” and “genetics” is very high. But even though genetic variation can and does cause feet to number 0, 1, 3, etc – that’s a very small contribution to the pool of variation. So the apparent genetic contribution to the variation in number of feet is quite low – almost immeasurable. This gives the impression that something else governs the number of feet we have, when in fact it is genetics.
To me, this made a great deal of sense and helped me figure out how much weight to give to heritability and r constants.
This seems to be a poor example in that the distribution of feet predicted by genetics is a degenerate case. It lacks homoscedasticity, linearity, Gaussian errors…
This is a reason to want to see a graph, not a reason to distrust the statistic in general.
Ooh, that’s a great analogy.
Didn’t Ron Unz get something like 0.8 once?
Discussed above.
Stalin: putting the “dic” in “dictator” since 1922.
My favorite (and utterly true).
That comparison is nonsense. Correlation coefficients are absolutely the wrong measure here. That makes it sound like if you wanted to predict the child’s wealth, you would multiply the adoptive parents’ wealth by 0.23 and the biological parents’ wealth by 0.13, add them together and add a constant. That is not true. In fact, the opposite is probably true: that the regression coefficient for the biological parents’ wealth is larger than the regression coefficient for the adoptive parents’ wealth.
Correlation coefficients tell you how much variation in Y is predicted by variation in X. But by restricting to children given up for adoption, we have restricted variation in X. Such parents are, as you say, very unusual. The variation in the wealth of such parents is lower than the variation of the general public. (Adopters are probably also unusual, but I don’t know. The study should have measured both variances, but I don’t see it.)
To make up for the restricted variation in the parents, they should have used regression coefficients. They have units: how many units of Y to predict from units of X. How many kroner of children’s wealth should you predict from a krone of biological parental wealth, and how many from a krone of adoptive parental wealth. The adoptive parents have 4x as much wealth as the biological parents. If the standard deviation is also 4x, then regression coefficient for the biological wealth would be 2x the regression coefficient for the adoptive wealth, even though the correlation coefficients have the opposite ratio.
(This is all phrased as if the paper were regressing on wealth. Money is usually log-tranformed, and the authors say that they tried that, but it is nonsense because wealth is often negative. So instead they used rank order of wealth. This sounds to me like a pretty reasonable choice, except that it exacerbates the problem I’m talking about here by moving the normalization earlier in the process. This is probably related to why I didn’t see variance listed in the paper.)
The part where they compare the adopted children to the biological children of the adopters and the correlations add (0.2+0.1=0.3) is a more reasonable comparison.
I think that my parenthetical paragraph contains an error. I now believe that the wealth rank is among the whole cohort of Swedes of a particular age, rather than just among biological parents of adoptees or among adoptive parents. Thus it does not push the normalization earlier in the process. It is quite sensible. But since the variation has not been normalized out, it is meaningful to publish the variances of the various groups, so this is not the explanation of my failure to find those.
Wealth dispersions for the different groups are reported in Table 1.
The biological parents of adopted children have a wealth SD of 670,000 SEK. The adoptive parents have a wealth SD of 2,200,000 SEK (which is similar to all parents). So there’s a huge variance difference between biological and adoptive parents. This is also reflected in the wealth SDs of the children: the SD of children raised by their biological parents is almost twice that of the adopted children.
Thanks!
The SD of wealth of the biological children is 2x the SD of wealth of adopted children, but the SD of wealth rank is smaller for biological children than for adopted children. A little weird.
I made a slight error in saying 4x where I should have said 3x. As I guessed, the SD ratio was the same as the wealth ratio: 3x. If we were doing regression on linear wealth, we should multiply the correlation coefficients by this. But this is what we should expect if the SDs of log-wealth are the same. Indeed, the wealth rank SDs were all in the range 0.27-0.30. So switching from nonsense correlation coefficients to sensible regression coefficients does not make a difference.
(Hey! the population has a variance of 0.29. So there is hardly any reduction of the variance in any of these populations. That is very weird.)
“A little knowledge is a dangerous thing”
A little learning, too.
Would Binned Analysis work better for these kinds of low correlation factors? For the IQ & Crime data consider in ‘BEWARE SUMMARY STATISTICS’ grouping into deciles would show clearly that all the crime occurs in IQ < 100.
Particle Physics has a lot of techniques to avoid over-fitting models and determining whether a local peak is actually significant.
This seems like a good time to bring up Anscombe’s quartet.
As if there’s ever a bad time to bring up Anscombe’s quartet.
“The authors write that:
While we have established the relative role of nature versus nurture”
Well, I’m glad that’s cleared up!
Seems like researchers should read “Beware the man of only one study” before writing about their studies.
Neither matters a whole lot?
I would have thought that wealth of natural resources would be the first place to look when attempting to explain wealth differences between states (or countries).
I dunno, Switzerland isn’t rich because they struck oil, and neither is Massachussetts.
I ran my own correlations taking out all the states that seemed to have unfair natural resource advantages (Alaska, ND) and other unfair advantages (DC’s government, Delaware’s corporations, Hawaii’s tourism) and the IQ correlation increased only very modestly.
The dependence of Louisiana’s economy on natural resources is partly obscured by the fact that the gulf isn’t included in the count of state oil reserves (link). They are officially ninth in oil, but second in refineries with 19, behind only much larger Texas (for comparison, AK has 6 refineries, OK 5, ND recently built its second). Gulf oil extraction and knock-on economic activity may go a long way towards explaining the anomaly.
(Incidentally, the GDP figures you’re using are from 2007, before the oil boom in ND. It has since skyrocketed to 2nd in GDP per capita.)
As I understand it the distribution of refineries is more or less frozen as of the mid-1970s because of the way the grandfathering rules were written in the Clean Air Act. A single brick from a preexisting refinery allows a new refinery built at that location to be subject to much less restrictive rules than a greenfield refinery built anywhere else. Hence the proposed pipeline from Alberta to Louisiana.
All of which is to say that I wouldn’t take the number of refineries in Louisiana as proxy for geographically local oil resources as of 2015.
Okay, but did you read the link?
A recent study by the Mid-Continent Oil and Gas Association includes all federal Gulf production in Louisiana’s column “because the great majority of the offshore production is serviced out of Louisiana ports.” Including the offshore production as 100% attributable to Louisiana, the state produced about 1.45 million barrels a day in 2013 to rank second behind Texas production of 2.56 million barrels a day, and ahead of third place North Dakota, which produced 858,000 barrels a day.
The number of refineries turns out to be a fairly good proxy everywhere except North Dakota.
Conclusion: Louisana’s motto should probably be “You may be smarter than us, but you are not more adjacent to the Gulf of Mexico than us.”
“Highly defensible terrain” might not technically be a resource, but it’s the same kind luck-of-the-geographical-draw.
(I suppose that being an island of a certain size could also be similarly helpful. I note that England and Japan have both had outsizes impacts on world history. In the case of Britain, this notably started after they were no longer fighting with the Welsh and Scots.)
Rivers, ports, trade routes. Until the train era, those three things were the most important natural resources which predicted civilization and economic success. Massachusetts had all three, Switzerland controlled some of the most important trade routes in Europe. You almost can’t overstate those as factors. (Especially rivers).
They still ARE, although the definition of “trade route” has somewhat changed.
“Town is on highway, they build New Highway a few miles away, town dies a slow death” is an incredibly common phenomenon. In this case “trade route” is best defined as “on the best line for highways”.
Delaware’s wealth isn’t the result of a lot of corporations being nominally headquartered there. Corporate registration is very cheap, so the state treasury sees very little from that source, and only some law firms (many in New York) actually make much money from work related to those registrations.
Delaware is wealthy primarily because of one corporate headquarters, and that historically much of that corporation’s manufacturing was in or near Delaware. That corporation is DuPont.
You would have been wrong. There is actually a negative association between the amount and ease of extraction of natural resources and subsequent economic growth. Countries rich in easily exploited natural resources tend to have those resources captured by native elites, who use that wealth to primarily enrich themselves. Countries in which the natural resources are more diffuse or harder to extract at the formation of primary institutions must cede more political power to extract the wealth.
The classic examples here would be something like Saudi Arabia versus Switzerland. Even the US, which has vast natural resources, didn’t when it was founded. Farming was the primary resource extraction, and the technology of the day meant that political power had to be ceded to the local level so they could handle their business. Had the US been settled today, the story would be far different.
If wealth is being measured in GDP per capita, as it is here, Christopher’s claim is absolutely correct. Qatar, Brunei, Kuwait, the UAE, Saudi Arabia, and Bahrain rank among the world’s fifteen richest countries. Alaska, North Dakota, and Wyoming rank among the ten richest states. All of this is because of oil, and for no other reason. The presence or absence of oil must be controlled for in making interstate or international wealth comparisons.
“There is actually a negative association between the amount and ease of extraction of natural resources and subsequent economic growth.”
-What studies did you look at? So far as I’m aware, natural resources tend to contribute only very modestly to economic growth, but aren’t negatively correlated with it.
Be careful with crude correlations between natural resources and economic growth. A priori I would expect there to be a floor of political stability beneath which natural resources will do little good and above which they will transform your country into the next Kuwait.
https://en.wikipedia.org/wiki/Resource_curse
It’s not an unassailable theory, but seems to fit the data better than most.
According to the Wikipedia article,
“Using that variable to compare countries, it reports that resource wealth in the ground correlates with slightly higher economic growth and slightly fewer armed conflicts.”
Russia, Chile, Canada, Norway, Australia, China, Malaysia, the United States, and Saudi Arabia are all pretty resource-rich. But on the other hand, so is the Congo and Angola.
The countries in sub-Saharan Africa with significant oil reserves per capita are Equatorial Guinea, Gabon, Angola, and Rep. Congo. They rank (respectively) first, second, fifth, and eighth in GDP per capita for the region.
These countries are not counter-examples to the thesis that oil generates economic growth. They are powerful evidence in its favor.
Edit: The economics papers cited in the Wikipedia article do not appear to study the association between economic growth and natural resources per capita, which makes them approximately worthless.
By most accounts, Angola and Rep. Congo are two of the worst countries in sub-Saharan Africa to live in. The latter has been ravished by civil war and a recent NYT report I saw on the former said that it has one of the highest infant mortality rates in the world. I don’t know as much about Equatorial Guinea and Gabon, but I’m guessing they’re not picnics either. If those countries have high GDP per capita, it doesn’t seem to translate into a high standard of living.
I rather embarrassingly confused the two Congos in my last post.
Reading about Gabon it seems to be doing pretty well: I didn’t know anything about it until just now.
This list — https://en.wikipedia.org/wiki/List_of_African_countries_by_Human_Development_Index — has Gabon, Republic of Congo, and Equatorial Guinea moderately high in human development. I count them and four other non-trivially sized sub-saharan African countries with “medium human development.”
One of the three factors of HDI is gross national income per capita.
Infant mortality is high in Equatorial Guinea, Angola and Rep. Congo, notwithstanding the black lucre. So there is that. But the correlation between oil reserves per capita and GDP per capita for comparable countries is almost certainly going to turn out large and positive, based on my pretty thorough ogling of the data.
This says that the most resource-rich states are Venezuela ($14.3T), Iraq ($15.9T), Australia ($19.9T), Brazil ($21.8T), China ($23T), Iran ($27.3T), Canada ($33.2T), Saudi Arabia ($34.4T), the US ($45T), and Russia ($75.7T). But I wouldn’t take that list too far — the estimates I’ve seen for the Democratic Republic of the Congo run at about $24T.
Then there’s Japan, listed in the CIA World Factbook as having the natural resources “negligible mineral resources, fish”.
If you eyeball a map, you can see the obviously-caused-by-oil difference between Norway-and-the-Arabian-Peninsula and everything else, and then the probably-caused-by-either-IQ-or-something-itself-caused-by-IQ difference between countries like the US, Japan, and South Korea and countries like the Democratic Republic of the Congo.
I think a lot more credit needs to be given to the creation and maintenance of social and political institutions that contribute to a stable society with enough innovative energy to grow economically.
Of course, many of these institutional forms are basically accidents of history formed for political ends long since defunct, but which continue on in different modes.
Shooting from the hip, I’d say that of factors contributing to a country’s economic success or failure, they are something like:
70% quality of institutions, respect for property, rule of law, etc.
20% local culture and mores regarding work, family, etc.
8% natural resources
and 2% IQ of the populace
I mean, to begin with, North Korea had the same people (roughly same IQ), same culture, roughly equal natural resources, etc. and now I’m pretty sure they are *no more* than 30% as well off as the South Koreans, on average, probably worse.
NOW, I’m sure the North Koreans now have lower IQs due to malnutrition, etc., as they have lower heights, and their culture has inexorably changed as well. But most of this comes from bad institutional changes forced on them from the outside.
Of course, maybe certain factors tend to increase or decrease the likelihood of a “good institutions” score, and I suspect having a lot of natural resources may be one of them. Therefore, while having a lot of natural resources may net you 8 points, it may, in many cases, detract more than 8 points from the “good institutions” score and therefore, on average, be a net negative.
As for whether populations with higher IQs tend to establish better institutions, the answer is probably yes, and may mean that IQ is a good deal more important than the 2% above might lead one to believe. But I think the example of North Korea shows that imposing a bad institution from the outside can easily cancel out any genetic, cultural, or resource-based advantages.
Conversely, if you forcibly imposed a really efficient, smart, non-corrupt government on Haiti (which can never happen anymore because “boo imperialism”), I’m sure people there would start doing much better quite rapidly, and their IQs would also rise to reflect better nutrition, etc.
Regarding the general impact of environment vs. birth: consider this: how much wealth would Steve Jobs have generated for the world and his local economy had he been born in the stone age? Or at the same time he actually lived, but in North Korea? Now imagine he had a really nice, nurturing family in the stone age, or in North Korea… would it change your appraisal at all?
Well clearly if you try to have a complete command economy and you don’t trade with anyone, then yes you are going to be poor. But outside of extreme examples, I’m not very convinced. For one thing, if institutions are so important, it seems suspicious that gdp per capita seems to line up so well by region. If institutions are so important, then would you really expect the entire region of sub saharan africa to be poor, the entirety of Western Europe to be rich and places like Latin America to be almost entirely in the middle?
WS–I’m not sure that regional clusters of economic performance point away from institutions and work norms as primary explanations. Sub-Saharan Africa has quite a lot of institutional similarity (think strong-man/kleptocratic governments and rampant corruption) owing to relatively recent and extraction-oriented colonial histories. See also the institutional similarities of Western Europe, US, Canada, Aus/NZ, etc., and at a slightly more fine-grained level, the institutional differences between northern and southern European nations and their corresponding levels of wealth. I know very little about Latin American political and economic institutions so I won’t touch that one, but East Asia appears to fit the pattern reasonably well, with somewhat similarly liberalized markets and authoritarian governments.
These are all really broad strokes, but institutions and norms seem to me massively important in determining the speed and stability of growth as economies advance from agriculture and resource extraction to more complex kinds of organization. The real question is what determines the institutions and norms you have today, other than passing the buck to the institutions and norms you had yesterday.
If institutions are so important, then would you really expect the entire region of sub saharan africa to be poor, the entirety of Western Europe to be rich and places like Latin America to be almost entirely in the middle?
Just looking at this — https://en.wikipedia.org/wiki/List_of_African_countries_by_Human_Development_Index — list, and ignoring the island nations, I count eight countries in sub-Saharan Africa with “medium human development.” Botswana’s success is almost certainly due to good institutions and governance: the country does not tolerate corruption, has gotten a lot of money from the De Beers diamond company, and is working on diversifying its economy right now in anticipation of the diamonds drying up. South Africa similarly has good institutions relative to the rest of Africa.
I note also that five of the eight were former British colonies (Botswana, South Africa, Namibia, Ghana, and Zambia), and my impression is that the British tended to leave pretty good institutions in their colonies. For example, Mugabe was handed a country that was his to ruin; Zimbabwe could easily be on the above list if he hadn’t destroyed its economy.
But don’t the extreme examples simply prove the point? If having really great institutions consistently produces great results with every culture, geographic region, and people, and if the opposite is true of really awful institutions, then why would we expect different rules to apply in the middle? Why else would the per capita income of Singaporeans be 5.5 times that of Malysians?–and Malysia’s institutions aren’t actually that awful; Singapore’s are just very good. Yes, good institutions attract smart, hardworking people, as I’m sure Singapore has, but we can count that under the salutary effect of good institutions.
@WS,
Yeah, you kind of would. Western Europe has a common institutional heritage in the Renaissance and Enlightenment.
Latin America was two massive empires then conquered and ruled by a third empire, with very specific laws, language and culture.
If one wants to be very specific with things, nations colonized by England tend to do much better than ones colonized by Spain. Given the differences in some of the locales, this would seem to be a result of the institutions bequeathed to them by the imperialists. Of course, the variance is still high, you have to account for the state of the native populace, but a strong case can be made that Europe developed some distinct philosophies, institutions and social structures that led to its advancement and aggrandizement. Within Europe, Britain outpaced all other nations. The entire US is culturally an outgrowth of that tradition.
Niall Ferguson has a great book outlining this much better than I can, titled “Civilization: The West and the Rest”
“The real question is what determines the institutions and norms you have today, other than passing the buck to the institutions and norms you had yesterday.”
That is the real question, and an incredibly complex one, of course. I think geography and climate definitely matter: being somewhere convenient for trade but not ripe for takeover seems to be good–somewhere like Switzerland, and another reason natural resources may be a double-edged sword.
But I think people like Helmut Schoeck and Dierdre McClosky also make a good case for why ideas really matter: bad institutions aren’t randomly bad; rather, people tend to fall into predictable error patterns throughout history: envy, tribalism, protectionism, imperialism, bias against people who trade and work with money rather than directly producing, etc. etc. To the extent these can be overcome with better ideas, that seems to be the extent to which good institutions can flourish.
Of course, this just brings us up a level to “what allows good ideas to flourish,” which again goes back to all kinds of historical contingencies, etc. so it is kind of an endless loop, but necessarily so, I think. But since we can’t generally do anything about geography, etc. I think the best thing most people can do is to try to think of and spread good ideas.
Isn’t forcibly imposing a really efficient, smart, non-corrupt government on the population basically what Singapore’s Lee Kuan Yew did? Although it seems quite plausible that what he did was really impose such a government on his political party first and foremost.
Pretty much… and I think Singapore is much better off for it. And the irony is that the Singaporeans still display, albeit to a lesser degree, perhaps, all the same biases people do everywhere else. It’s just that the better system has been imposed on them from without, and their thinking has gradually adjusted.
They have some kind of peak traffic toll system which enables you to drive anywhere in the crowded city at the speed limit at any time of day, but which is widely disliked by the actual people, for example, most likely due to the inegalitarianishness of it.
And though there are legit elections, instead of having two legit parties and a bunch of loser parties, they have one legit party and a bunch of loser parties. And, honestly, that legit party deserves its good reputation because of all its done right the past 50 years. Yet it’s also true it was basically imposed from the outside to begin with: certainly not democratically selected.
And this is why, though I’m not a neoreactionary, exactly, I still think the effect of widespread faith in democracy is largely pernicious: it leads to people identifying with their governments to too great a degree, such that even benign foreign rulers become hated imperialists and even ultra corrupt locals are still OUR ultra-corrupt jerks. I would rather the US government be run by Sweden if the Swedish could do a better job. I don’t care if the people in the government look or talk like me.
@onyomi
And this is why, though I’m not a neoreactionary, exactly, I still think the effect of widespread faith in democracy is largely pernicious: it leads to people identifying with their governments to too great a degree, such that even benign foreign rulers become hated imperialists and even ultra corrupt locals are still OUR ultra-corrupt jerks.
I suspect that this has more to do with tribalism than it does with democracy. There are a lot of nationalistic countries that aren’t democratic that would view a foreign but benevolent government just as negatively or even more negatively than a democratic country would.
True. Tribalism is the bigger, underlying problem, and rejecting democracy probably isn’t enough to remedy it. But I think democracy is the most prevalent excuse for tribalism today and that people tend to identify more strongly with their own governments now that they have some say in choosing its makeup as compared to when it was just some king or lord who got the job because he inherited it from his dad.
But I think that democratic nation state mentality has now permeated the world to an extent that even non-democratic nations feel their leaders “represent” them in some way. Kim Jong Un may have only gotten the job because his dad and grandfather had it, but he’s OUR guy who only got the job because his dad and grandfather had it, goddamnit (of course the DPRK actively encourages this thinking to an extreme degree).
I think tribalism, like envy, anti-foreign bias, fear of authority, and a number of such biases will always be with us because they are genetically ingrained. The question is who can develop a system and accompanying ideology that suppresses such tendencies and rewards our good qualities. And democracy, at least as it exists in most places now, aint it.
(obligatory mention that racial demographics and crime at the municipal level are correlated considerably above r=.4, even when you expand the dataset.)
I’d caution against putting too much stock in r and r^2 — they can obscure more than they reveal. In particular, if you’re using a linear model and it’s misspecified — i.e. if the “true” relationship between predictors and outcome is nonlinear — then your correlation coefficients will depend in large part on the distribution the data is drawn from, rather than any meaningful property of the model itself. For an illustration, let Y = X^2 + N(0, 1), and let X be drawn uniformly from (0, 0.1); from (1, 2); and from (-3, 3), and see how the regression lines and the coefficients change.
Plus, if your data doesn’t follow the standard assumptions of linear regression — if the model is misspecified, or the residuals are non-Gaussian or heteroscedastic — this messes with attempts to do standard interpretation of linear regression in complicated ways I don’t really understand.
Your linked article on race doesn’t take into account the obvious confound of poverty. It also has the somewhat amusing assertion that “the crime correlation for Hispanic or Hispanic-plus-Asian numbers has been substantially more negative than the same figure for whites, but this does not necessarily prove that whites are much more likely to commit urban crime” while blaming “blackness” for the entirety of their coefficient.
I suspect motivated reasoning
Once accounting for poverty, I would guess that Hispanics come out looking like angels compared to all other races. Blacks would still be the highest criminality group, and I would also guess that the rate of gang violence is a large part of that (which may well be due to some genetic deficiency or whatever you want to say)
The other problems with using r and r-squared you bring up are the main reason that graphs are almost always included. These measures are also fairly robust to the heteroscedasticity issue, but if the graph suggests that this is a major problem, it can be addressed.
The thing I posted on my Tumblr talks about poverty. We tried doing causal inference on the dataset but got wildly varying results based on what search method we used. Best guess seems to be that race and poverty have independent causal effects of roughly equal size, but we haven’t even ruled out the hypothesis that high crime rates cause rich people and white people to flee, which would have the causal arrows pointing in the exact opposite direction. So who knows.
Anyway, the point of bringing up that Unz article is that it’s a fantastic response to causal claims made on the basis of correlations at, like, the r=0.33 level. If you’re willing to say that the Swedish study proves that your parents have a huge effect on your wealth, what should you be willing to conclude about race and crime?
Without proper controls for income? Not that much (although I did say that I believed blacks would still be the highest criminality group even after controlling for poverty). An improperly run test can be much much more misleading than an error in interpretation magnitude.
And, as I said above, the Swedish study absolutely does not prove that your parents have a huge effect on your wealth.
The second link found a correlation of .45 between race and crime for “places with poverty rates between 20 and 30 percent.” That’s still higher than r = .33.
Sorry, I didn’t actually mean you, you. I meant generic you. Like: what should Joe Pinsker at the Atlantic be willing to conclude about race and crime? (Keep in mind that Joe Pinsker doesn’t know more about model specification or unmeasured variables than Joe Schmo.)
@haishan
Yep, my bad. I could’ve taken a more charitable interpretation
@Troy
Second confound of cost of living. Third confound of drug use (whether through territorial violence or addiction-motivated violent mugging). Fourth confound of arrest rate/policing bias. Fifth confound of nonlinearity in data (notice that the graphs are on the log scale to look linear, but the analysis is not done on that scale. The article does claim that this actually increases the correlation coefficient, but that’s a weird reason not to use it). Sixth confound of heteroscedasticity.
Again, the point is that .45 is something like an upper bound on what the true causal relationship could be. This is 22.5 percent explained variance. This is totally different than the claims of 0.8 made above.
I’m not arguing to defend the Atlantic article. I’m simply arguing that the interpretations in these posts are also inappropriately confident.
People will go around citing the 0.8 number as accurate (in fact, @nydwracu does this below) even though it is wildly misleading.
Beware
summarystatistics.(sidenote, it would be literally impossible for the poverty and race measures to be independent as you’d have better than perfect information?? if you knew both since they both have above 50% explained variance)
My complaint about correlation coefficients vs regression coefficients applies to the r=0.45 correlation between race and crime when restricted to the the 3rd decile of poverty. That sounds like two thirds of the original r=0.7, but the natural comparison is the regression coefficient, which is even smaller, probably half of the original, because the remaining variance being explained is smaller. (I got half by eyeballing the graph, but that’s log transformed.)
@Douglas Knight
This is a really good point. You can have a 1.0 correlation coefficient even if the presence of additional black people predicts very little additional crime. Maybe a measure like predicted number of crimes per 100,000 people of each group would give a better intuitive sense of how big the effect size is in practical terms?
Indeed, the regression coefficient is such a prediction. Because it has sensible units, you can use it to compare the effect in the general population to the effect in a restricted population.
But if you want to compare the effect of race to the effect of poverty, you need something dimensionless, like a correlation coefficient.
I created three datasets with random variables X, Y, with Y = X^2 + N(0, 1) and the distribution of X varying.
When X is uniform over (0, 0.1), the noise term swamps the variance due to X, and the plot looks like random noise. Unsurprisingly the r^2 here is 0.
When X is uniform over (1, 2), we get what looks like a fairly robust linear relationship, with an r^2 of 0.44.
When X is uniform over (-3, 3), the relationship is quite obviously non-linear; just as obviously, there is a relationship. But if you just looked at the r^2, it is again 0; unless you glanced at the scatterplot, you might mistakenly conclude that X and Y are independent. Correlation coefficients can’t distinguish this situation from our first one.
For simple datasets with just a single feature, instead of looking at correlation, you can look at the MIC: https://en.wikipedia.org/wiki/Maximal_information_coefficient
It’s a mutual information based measure that can capture non-linear relationships (between two variables) very well. Give it a shot – there’s an excellent open source implementation in an R/Python package called MIME.
This was totally worth the ten cents I paid for it on Patreon. Very glad that I couldn’t think of anything better to do with my money.
(A)fter a certain point, the wealthier your biological parents were, the less likely you are to be wealthy
I wonder if that has to do with the fact that people who give their children up for adoption (or who have their children taken off them into care) tend to be younger (the archetypal teenage mother) and/or poorer, so that there’s a better chance the child will end up with relatively-by-comparison better-off adoptive parents (equally poor parents have kids of their own/can’t afford to adopt by the formal process; the informal process of ‘take in dead Cousin Lou’s kids if we don’t have any of our own’ probably applies there).
Whereas from wealthy families, if they give up a child for adoption, it’s less likely the child will be adopted by relatively-equally-or-better-well-off parents. So after a certain level, if your birth family has enough money but still gave you up, it’s likely you won’t end up in a family of equal or more wealth/income and so you are less likely to do better than your biological family? Unless we’re to take it there are “Scrooge McDuck” genes for making money and you should be able to pull yourself up by your bootlaces from the gutter to billions simply by the force of heredity?
Re: intelligence tests in general, I don’t know if they measure IQ (I don’t even know what we say we’re measuring when we measure IQ). I think they may give us a general idea of how well Johnny does by comparison with Susie when it comes to problem-solving, but we can get that anyway from classroom tests.
Completely unscientific anecdote here: I did this online Vocabulary IQ test and ended up with a score of “Your score converts to IQ 126”. Well, smart little old me, right?
Except I also did an online Raven’s Matrices test, which gave me a score of IQ 99. Just call me “Dumbo” 🙂 Given that Raven’s Matrices test on maths and pattern-matching, and I am hopeless at maths and pattern-matching, I didn’t expect to do great and I wasn’t disappointed by the score.
So IQ tests – what do they measure and is there any point? Given that the average IQ for Ireland is by one source 105 and by another source, our old friend Richard Lynn, 93 – I am inclined to imagine that scores for Haitians of allegedly average IQ 70 mean little or nothing. Are we really that hugely different from the island next door that we’re seven whole points lower in IQ than they are?
Maybe IQ tests are right about the Haitians and the Irish, but does that really make a difference? I do think IQ tests measure how good you are at doing IQ tests, and very little else. I now stand back and wait to be jumped all over with hobnailed boots on by people telling me they are so really important tools and completely scientific and do indeed measure a real measurable thing that is not variable and is not culturally bound and is not at the mercy of the prejudices and biases, unconscious or not, of the testers.
If you look at a summary study by Professor Richard Lynn, one of those quoted in the “Atlantic” article for his “IQ and the Wealth of Nations”, it is (pardon the language) all over the fucking place. He takes 100 as the norm – fair enough – but gives that to Britain, through some complicated calculations I am too much of a poor ignorant Paddy to understand. Then he compares everyone else to that 100. You’ll be glad to know, USA, you come out as IQ 98 so you’re very nearly as smart as your colonial parent 🙂 Us ignorant bogtrotters are IQ 93.
Unless we’re IQ 87, which is another result in a table he gave. Based on tests of Coloured and Standard Progressive Matrices for 6-13 years old giving an IQ result for Ireland. The equivalent for Britain (the normed 100) was for 6-15 years olds, and the equivalent for the USA (giving that IQ 98) was for 18-70 years old.
I’d like to stick this quote in here from Professor Lynn’s short summary:
So he takes ONE region of England – the capital city, London – and compares it to the WHOLE of Ireland. Taking incomes from the 60s, when Ireland was just beginning to start getting its mini-wave of prosperity, and comparing it to London, a wealthy capital city. And using IQ scores obtained twenty years earlier. Result: backwards Irish 96, perfectly ordinary salt of the earth Londoners 102.
So Ireland vacillates somewhere between IQ 87-93, while Britain and the US are always 100 and 98 respectively.
I don’t necessarily want to say that there might perhaps be some element of bias in his methods, because that might look like the standard “Blame the Brits” version of Irish history, but I don’t think he’s being perfectly impartial. And when he’s producing work that gets quoted in the media and online as solid scientific evidence that X is better than Y because people of X have bigger brains, then I think that’s important to consider.
Much more likely it’s simple regression to the mean. Sure parents can give their kids all sorts of advantages, but at some level, it’s relatively impossible for them to exceed the parents. Warren Buffet’s kid is unlikely to make more than his dad. Bill Gates’ progeny too.
Of course, this regression to the mean has its limits, and applies to things like IQ, motivation, and all sorts of other vague categories of attributes.
This effect cannot be explained by regression towards the mean. Regression towards the mean is an effect causing past high performers to be less impressive than their past performance, but they are still on average more impressive than past low performers. Regression towards the mean flattens things out, it doesn’t reverse polarity like the polarity is reversed at the edges of the biological parent wealth graph.
“(A)fter a certain point, the wealthier your biological parents were, the less likely you are to be wealthy” (you’re talking about diagram 2a, right?)
Scott, the explanation is that there are very few wealthy biological parents, so the error bars at this portion of the diagram become huge (as you can see). This makes the trend line go haywire. Quite often trend lines applied to data do weird things at the extreme ends of the x-axis, so one should ignore any weirdness.
PS Note that there is also a weird hook at the left hand side of 2a (as well as the RHS). The authors should have just inserted a linear fit, instead of trying to be too clever with a fancy-ass polynomial.
The numbers for Ireland are from 1981. Ireland was still in pretty poor shape. Most of the education system was still crippled by the incompetence of nuns and their teaching methods.
My grandfather would have been alive back then and he was close to functionally illiterate like many his age. My father remembers electricity being rolled out to his house. I wouldn’t be surprised at an average of 93 at that point in time compared to a country which had had a more effective school system for far longer.
I’m a Yank, the daughter of a Hungarian Jewish engineer, and I test improbably high on IQ tests (I am a good little test taker). On Deiseach’s word test, I got every question right (I also worked in the publishing industry). I moved to Ireland about a year and a half ago. My Irish husband knows how I was brought up and lived in the US. His mother, resident in the border country south of Strabane, thinks I am an adorable dolt for having to learn, in my late 40s, how to line dry clothes, manage a heating oil system that also operates the hot water, use a fireplace to heat the house, or know how long to keep cream before it goes off, or drive with a manual transmission. So much for IQ tests. 🙂
I’m a Yank, the daughter of a Hungarian Jewish engineer, and I test improbably high on IQ tests (I am a good little test taker). On Deiseach’s word test, I got every question right (I also worked in the publishing industry). I moved to Ireland about a year and a half ago. My Irish husband knows how I was brought up and lived in the US. His mother, resident in the border country south of Strabane, thinks I am an adorable dolt for having to learn, in my late 40s, how to line dry clothes, manage a heating oil system that also operates the hot water, use a fireplace to heat the house, know how long to keep cream before it goes off, or drive with a manual transmission. So much for IQ tests. 🙂
Also, please rid me of this troublesome extra post 😛
I seem to recall that if you click “edit” (in the lower left corner of your comment) and delete all the contents, the post should go away.
IQ is not the same thing as skills. Your lack of those skills is due to environmental causes, not IQ. A low IQ person raised in the same environment you were raised in would also lack those skills and may very well be slower at learning them when they move to an environment that needs them.
A few years in to NZ’s most recent farming boom I met a woman who was training city kids as farm workers. Officially. Unofficially she was training farmers as modern-day employers. This meant teaching them that just because a city kid didn’t know how to dig a hole for a fence post didn’t mean the kid was dumb, even though that would be the case for a farm-raised kid.
Another chunk of her job was pointing out that paying $10,000 a year for a 6 day week wasn’t going to get many takers.
IQ is in large part a measure of pattern matching and your ability to learn.
Do you think IQ is supposed to be some kind of magical ability to know everything even if you’ve never had a chance to learn it before?
You can have an IQ of 200 but if you’ve never learned how to drive a manual transmission you’ve never learned how to drive a manual transmission. IQ doesn’t make the knowledge appear in your brain without learning.
Now, if you have a complete inability to learn after being shown that’s a different matter.
Someone who might have been very good at learning in general otherwise can have that ability dulled by never getting the chance to practice that ability because he has to spend his life lumping around sacks of grain. Lock someone who would have been bright in a convent against their will with nothing but fairy stories and beat them when they try to learn anything proscribed and you can still end up with someone with a dulled ability to learn and adapt. Ireland was pretty grim in the 70’s and earlier.
*cue An Extract From Captain Stormfield’s Visit To Heaven*
If educational quality affects your score on IQ tests (and I have yet to encounter an IQ test that couldn’t easily be affected by that), doesn’t that mean IQ isn’t genetic after all?
If wearing platform shoes affects your height, doesn’t that mean height isn’t genetic after all?
I have yet to see the string I couldn’t make look longer if you let me move the ends.
Whereas from wealthy families, if they give up a child for adoption, it’s less likely the child will be adopted by relatively-equally-or-better-well-off parents. So after a certain level, if your birth family has enough money but still gave you up, it’s likely you won’t end up in a family of equal or more wealth/income and so you are less likely to do better than your biological family?
I wonder if there’s some effect along the lines of “very wealthy parents only give up their kids for adoption if something is really messed up about the kid” going on? Or, given the point about error bars, “more likely” instead of “only”.
I imagine wealthy families only (or in the past, anyway) gave up children for adoption in the case of a scandal (wife is pregnant by another man, teenage daughter is pregnant and the families are determined there’s no way she and boyfriend are getting married at 19 and ruining their lives) or, as you say, because of mental/physical disabilities.
Though in that case, they’d have the money to pay for a discreet, pleasant facility to institutionalise the child.
Though in that case, they’d have the money to pay for a discreet, pleasant facility to institutionalise the child.
I would think that finding a nice childless couple with a bit of a martyr complex would be more pleasant, and possibly more discreet, than an institution.
I would think that finding a nice childless couple with a bit of a martyr complex would be more pleasant, and possibly more discreet, than an institution.
Because if a couple with less resources than you can successfully raise and look after your less-than-perfect child, that induces guilt: you can afford nannies and nurses and professional help but still don’t want the bother.
A suitably upscale professional institution where the child will be with others who also suffer from similar disabilities and where the idea is that it’s modern, medical, specialised – the kind of training and knowledge and resources lay people like either the natural or adoptive parents would never have – is much less nagging at the conscience about “You could take care of this child so you should take care of this child”.
And certainly in the past the push was to put mentally or physically handicapped children in institutions, rather than the modern idea of ‘care in the community’ or supported living at home.
The Republic of Ireland typically does reasonably well on the PISA and TIMSS international tests of students. For example, it did very well on the 2011 TIMSS:
http://www.erc.ie/documents/pt_2011_main_report.pdf
There’s another “error” in this style of argument about life results.
The error is failure so see that some outcomes appear to be functions of a list of necessary but not sufficient conditions.
Many poor outcomes appear to be results of failure to supply a necessary condition.
So if Success in Life S = (IQ * EQ * Ed * Health * Luck * AvoidAddiction * AvoidGangs * ….) where:
IQ = IQ
EQ = emotional quotient
Ed = education to the level where there’s a treatment effect
Health = Health
Luck = Luck
AvoidAddiction = 0 if you end up addicted to something nasty and 1 if you don’t
AvoidGangs = 0 if you end up hanging with a very bad-outcome correlated group and 1 if you don’t
Does having “good parents” or “wealthy parents” tend to help you avoid getting 0 in the addicition or gang scores? Probably. Help you have a good Health coefficient, or more importantly, avoid having a really poor health coefficient which could have been avoided by ordinary means? Very likely.
Note that crappy schools or various forms of bad Luck (hit by car) can still screw things up….
Math nerdy note:
The classical framework to examine the influence of different factors on an outcome is to use a linear model, the most general version is something like:
Y = BX
Where Y is your outcome, B is a vector of coefficients, and X is the design matrix, which contains the values of the different features that you think influence the outcome.
In this model, all the terms are explicitly additive. You can add non-linear terms to the design matrix, or augment it with polynomial terms, etc, but keeping everything additive makes the analysis much simpler.
You could also of course estimate a simple model where you only have one non-linear term defined as a product of all features, but that probably would not be very informative.
After all that preamble – the way you’d pose your problem in a classical framework, would be something like:
S = B0 + B1*IQ + B2*EQ + B3*Ed + B4 (IQ * EQ * Ed)
And then you’d do a standard test to see if B4 is significant. You first test to see if IQ, EQ, and Ed are significant in isolation, and then add an extra interaction term and check to see if that comes significant after the individual effect of the predictors has been accounted for.
In my experience, it’s very rare that triple interaction terms are significant after all 1st and 2nd order terms have been accounted for. You are basically saying that the combination of three features has a strong effect even after you’ve accounted for the effect of each of those features alone, as well as all the two-pair combinations.
EDIT: Problem fixed
But nonetheless, anyone claiming that a .23 vs .13 correlation is TOTALLY DETERMINING anything is nuts. At best, those sorts of numbers can be used to say it’s “somewhat related”
In general, if you want to claim a causal relationship, r-squared is probably the more intuitive measure.
Here is a good introduction to the messy messy world of reporting statistics that focuses on this distinction. (please do not share this link as this is already stretching the limits of my academic license)
The claim “Noah and the Atlantic were both perfectly honest and did a fine job reporting on their individual studies” is really not that plausible. The Atlantic did a terrible job at accurately summarizing the results obviously in favor of a political statement (even if it’s a statement I generally support). The data suggests that neither factor is an excellent predictor of future wealth and especially not genetics even though they are both factors. Noah more accurately represented the results of his study by saying something along the lines of: state GDP is related to IQ but is unconvincing as a major causal factor.
Yikes! Thank you, replaced with a more accurate plot.
No, the original is right.
Yup, dumb error on my part
In a case like this, might be better to generate your own plots. For example, here’s a script I just whipped up in R to generate scatterplots with 52 points of various r values, animated with 200 simulations:
https://i.imgur.com/v7XbP1r.gif
R code:
set.seed(2015-08-02)

rbivariate <- function(r, mean.x = 0, sd.x=1, mean.y=0, sd.y=1, n=1) {

   z1 <- rnorm(n)

   z2 <- rnorm(n)

   x <- sqrt(1-r^2)*sd.x*z1 + r*sd.x*z2 + mean.x

   y <- sd.y*z2 + mean.y

   return(list(x,y))

}

library(animation)

library(ggplot2)

library(gridExtra)

frames <- 200

saveGIF(

        replicate(frames, {

            r13 <- rbivariate(0.13, n=52)

            r23 <- rbivariate(0.23, n=52)

            r33 <- rbivariate(0.33, n=52)

            r41 <- rbivariate(0.41, n=52)
p13 <- qplot(r13[[1]], r13[[2]], xlab="x", ylab="y", main="0.13") + coord_cartesian(xlim=c(-2,2), ylim=c(-2,2)) + stat_smooth(method="lm", se=FALSE)
p23 <- qplot(r23[[1]], r23[[2]], xlab="x", ylab="y", main="0.23") + coord_cartesian(xlim=c(-2,2), ylim=c(-2,2)) + stat_smooth(method="lm", se=FALSE)
p33 <- qplot(r33[[1]], r33[[2]], xlab="x", ylab="y", main="0.33") + coord_cartesian(xlim=c(-2,2), ylim=c(-2,2)) + stat_smooth(method="lm", se=FALSE)
p41 <- qplot(r41[[1]], r41[[2]], xlab="x", ylab="y", main="0.41") + coord_cartesian(xlim=c(-2,2), ylim=c(-2,2)) + stat_smooth(method="lm", se=FALSE)
grid.arrange(p13, p23, p33, p41)
}),
interval = 0.8, ani.width = 900, ani.height = 900,
movie.name = "/home/gwern/yvain-correlates-visualized.gif")
You are my hero.